jquick-pdf 气泡图实战:跟着一条风险数据走完从取数到 PDF 的全程
摘要(meta description):气泡图是散点图的加料版——x、y 定位置,size 定敞口,颜色定等级,一条数据同时编码四个维度。本文以 jquick-pdf 气泡图为例,跟着"客户C:账龄 9 个月、逾期率 6.8%、敞口 410、高风险"这条数据走完全程:从 Map 组装、轴配置、图例挂载,到 renderChart 出 SVG、绑定占位符、模板落版成 PDF,每一站都有代码和渲染结果对照。附完整 Java 源码与模板(jquick-pdfx 4.7.0+,Apache-2.0)。
标签:jquick-pdf、Java PDF、报表开发、气泡图
官网示例:
- FORMULAS 示例页:https://www.jquick.org/jquick-pdf/demo/14_bubble/
- github 地址:https://github.com/paohaijiao/jquick-pdf
旅程起点:一条待画进报告的风险数据
评级报告的风险章节里躺着一条记录:客户C,账龄 9 个月,逾期率 6.8%,风险敞口 410 万元,风险等级"高风险"。业务方的要求是把六家授信客户的风险画在一张图上,横轴看账龄、纵轴看逾期率、气泡大小看敞口、颜色看等级。
四个维度一张图,气泡图是标准答案。本篇素材是官方 Demo JQuickCreditReport14BubbleTest,天蓝渐变主题评级报告,输出 D:\test\creditreport\14_bubble.pdf。下面跟着这条数据走全程,每一站看它怎么变形。(效果预览图 alt:jquick-pdf 气泡图信用评级报告 PDF,蓝色渐变抬头,客户风险敞口气泡分布与评级说明面板并排)
真实渲染效果预览
以下为上述代码 + 模板真实运行生成的 PDF 首屏预览(由 jquick-pdf 渲染输出,非示意图):
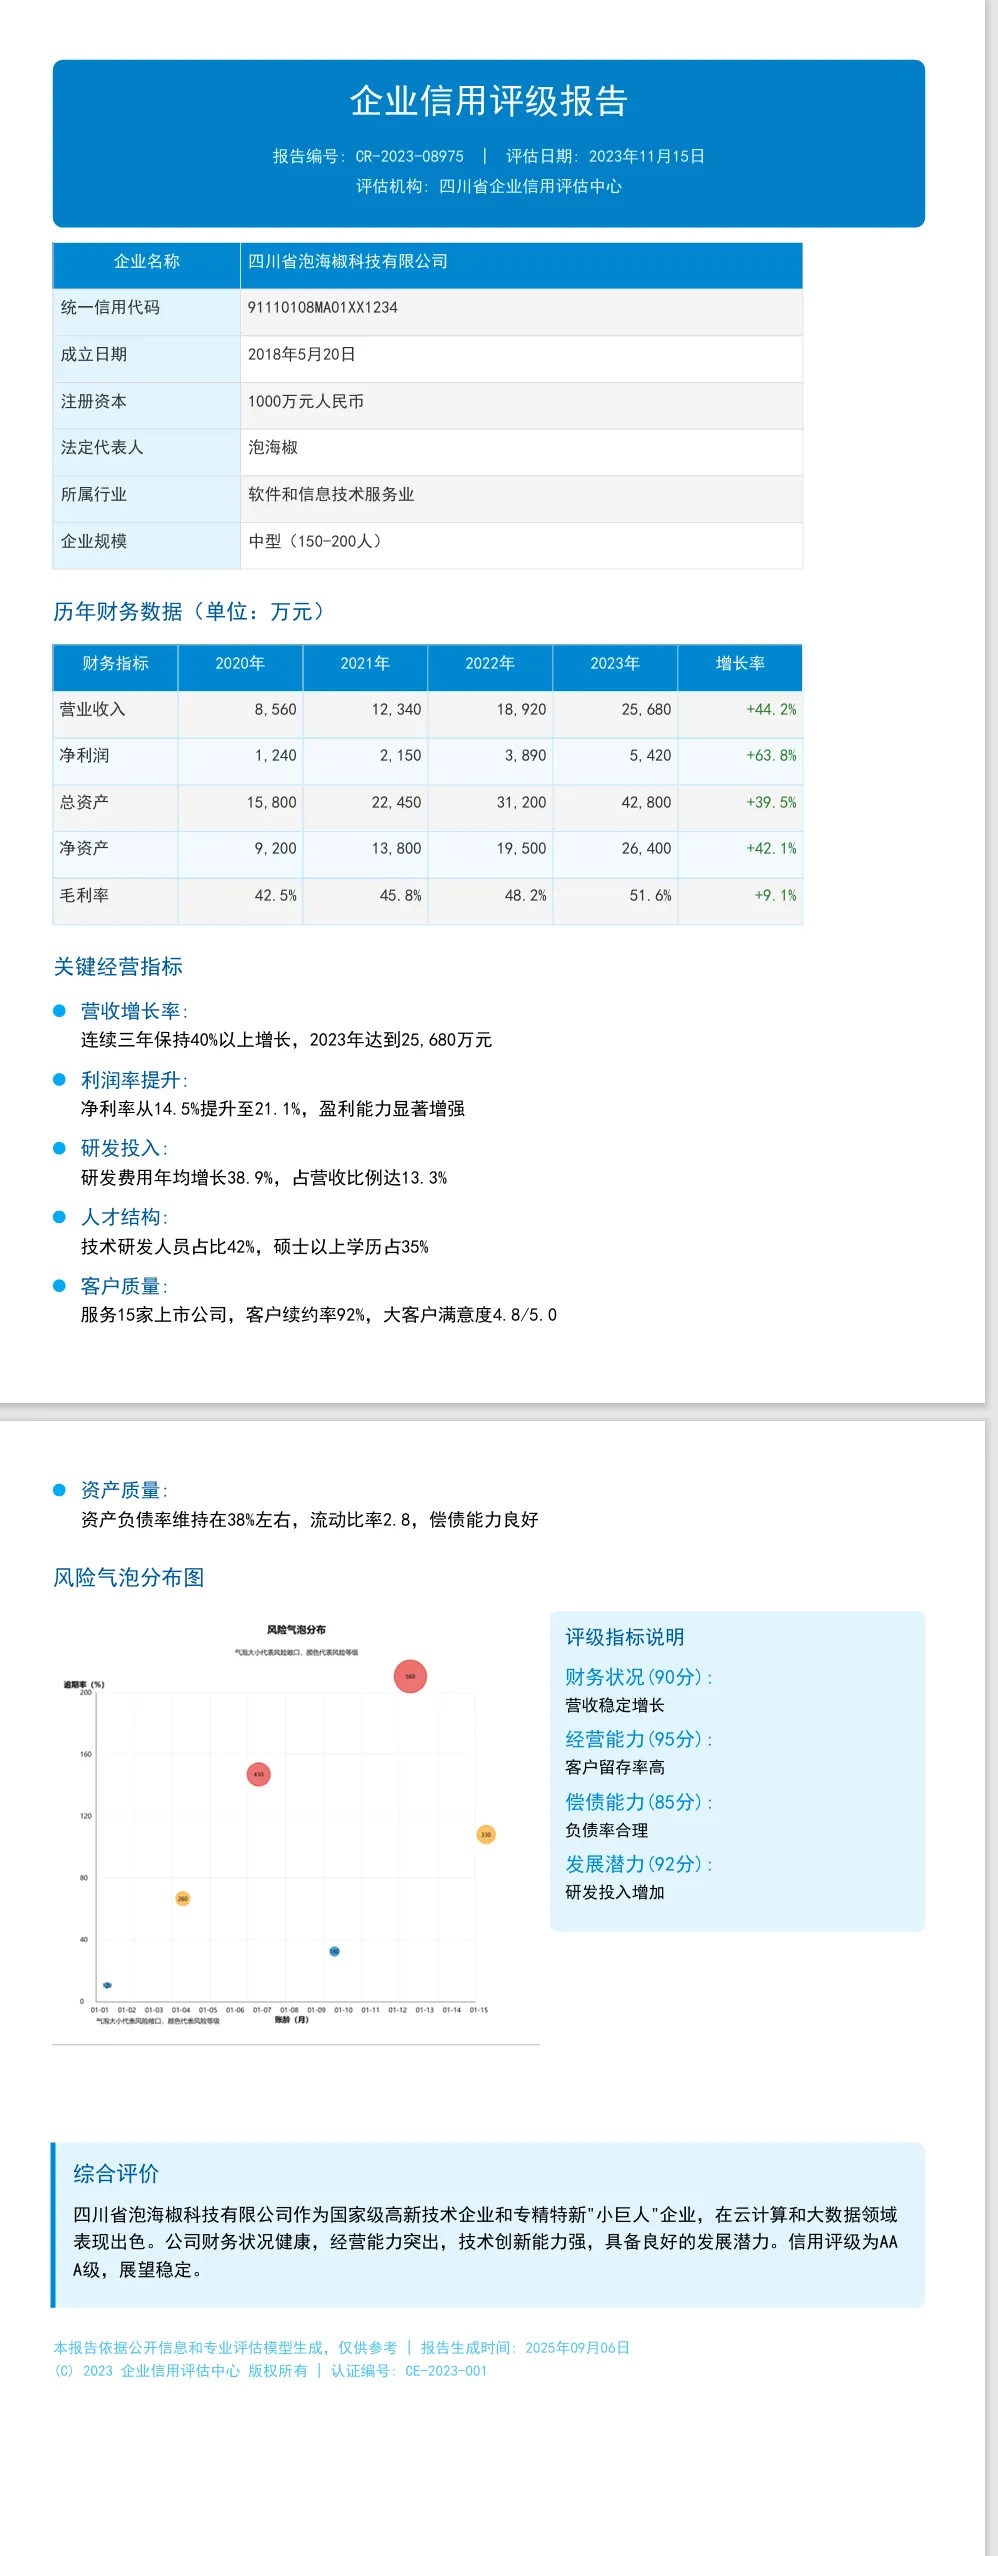
第一站:Map 组装——一条数据的六件行李
private static Map<String, Object> bubblePoint(String name, String x, double y, double size, String category) {

    Map<String, Object> point = new HashMap<>();
    point.put("x", x);
    point.put("y", y);
    point.put("size", size);
    point.put("category", category);
    point.put("name", name);
    point.put("color", bubbleColor(category));
    return point;
}
客户C 的数据在第一站被装进一个 Map,六件行李各管一件事:x 是账龄"9",y 是逾期率 6.8,size 是敞口 410——它决定气泡画多大;category 是"高风险",name 是"客户C",color 由等级换算出来。x 传的是字符串"9"、y 传的是 double,这是散点系数据的约定:x 走类目轴所以是类目标签,y 走数值轴所以是数值,类型别搞反。
color 这一趟在 Java 侧就定死了:
private static Color bubbleColor(String category) {

    if ("低风险".equals(category)) return new Color(2, 136, 209, 180);
    if ("中风险".equals(category)) return new Color(255, 167, 38, 180);
    return new Color(229, 57, 53, 180);
}
低风险蓝(2,136,209)、中风险橙(255,167,38)、高风险红(229,57,53),三档 alpha 全是 180——半透明的气泡叠在网格上不挡坐标线,多个气泡挨着时也能透出边界。客户C 拿到的是那颗红色。
第二站:挂轴挂图例——数据的坐标语义在这里定下
JOption option = new JOption();
option.title().text("风险气泡分布").subtext("气泡大小代表风险敞口,颜色代表风险等级");
option.legend("低风险", "中风险", "高风险");
option.xAxis(new CategoryAxis().name("账龄(月)"));
option.yAxis(new ValueAxis().name("逾期率(%)"));
这一站决定数据"站在哪里、归哪一类"。x 轴用 CategoryAxis 挂名"账龄(月)",y 轴用 ValueAxis 挂名"逾期率(%)"——轴名会渲染在坐标轴旁,报告评审不读正文也知道两条轴是什么。副标题这行写法值得记:title().text().subtext() 链式两连,副标题"气泡大小代表风险敞口,颜色代表风险等级"直接承担了图例说明的职责,四维编码里的 size 和 color 不用在正文再解释一遍。
legend("低风险", "中风险", "高风险") 传的三个词和 Map 里 category 的取值一一对应——图例不是摆设,它是渲染器给同 category 气泡归类标注的依据,词对不上图例就成摆设。客户C 的"高风险"在图例里找到自己的位置,气泡顶上挂上名字。
第三站:入列渲染——六条数据变成一颗 SVG
ScatterSeries series = new ScatterSeries("风险敞口");
seriesData.add(bubblePoint("客户A", "3", 1.2, 120, "低风险"));
seriesData.add(bubblePoint("客户B", "6", 3.5, 260, "中风险"));
seriesData.add(bubblePoint("客户C", "9", 6.8, 410, "高风险"));
seriesData.add(bubblePoint("客户D", "4", 2.1, 180, "低风险"));
seriesData.add(bubblePoint("客户E", "12", 9.4, 560, "高风险"));
seriesData.add(bubblePoint("客户F", "8", 5.2, 330, "中风险"));
series.data(seriesData.toArray());
option.series(series);

String svg = JChartRendererFactory.renderChart(JChartType.Bubble, option);
六条数据按账龄排进 ScatterSeries——系列名"风险敞口"和气泡语义对齐。data() 收 Object 数组,每个元素就是一个 Map。渲染类型 JChartType.Bubble,注意和其他图表的命名风格不同(有全大写也有驼峰,照 Demo 抄最稳)。
这一站结束,客户C 变成了 SVG 里的一颗半透明红圆:圆心落在横轴"9"、纵轴 6.8 的交叉点附近,半径由敞口 410 换算,名字"客户C"标在气泡上。整幅图的信息量在渲染这一步全部定型。
六条数据的排布也值得在入列前检查一遍。Demo 里账龄从 3 到 12、逾期率从 1.2 到 9.4,等级两低、两中、两高三档均衡——三档颜色在图上都有代表,图例三个词没有一个落空。真实授信组合不会这么巧,假如某一批客户全是低风险,图例里"高风险"三项还挂着却图上无泡,评审会问"红泡呢";遇到这种数据,要么把空档等级从 legend() 里摘掉,要么在正文里补一句"本期无高风险敞口",别让图例说图外的话。
y 轴选 ValueAxis 还有个实际好处:刻度由数值范围自动算,六家客户逾期率落在 1.2 到 9.4 之间,纵轴刻度自动铺开,不用手动定 0 到 10 的步长;x 轴选 CategoryAxis 则是因为账龄在授信场景里天然是档位(3 个月、6 个月、9 个月、12 个月),按类目原样摆标签比按连续数值算刻度更贴合业务读法。两条轴一连续一离散,坐标语义在选型时就想清楚,渲染出来才不会出现刻度怪相。
第四站:进模板落版——SVG 与说明面板并肩
<div style="display:flex; justifyContent:space-between">
  <svg style="width:390px;height:400px">${svg}</svg>
  <div style="width:300px; backgroundColor:#e1f5fe; borderRadius:6px; padding:12px">
    <h3 style="color:#01579B; fontSize:12; bold:true; marginBottom:8px">'评级指标说明'</h3>
    <!-- 财务状况(90分) / 经营能力(95分) / 偿债能力(85分) / 发展潜力(92分) 四条评分 -->
  </div>
</div>
SVG 以 390×400 的尺寸注入 ${svg},右侧 300px 宽的浅蓝 #e1f5fe 圆角卡装四条评分。这里是旅程的最后一道工序,也是最容易翻车的一站:display:flex 要生效,Java 侧的 config.getLayoutConfig().setFlexLayout(true) 必须开着,否则图和面板上下堆叠。整页天蓝主题从抬头贯穿到页脚:渐变蓝抬头(#01579B → #03A9F4)白字居中,企业信息表 #0288D1 蓝底表头加 #e1f5fe 浅蓝标签列,综合评价卡浅蓝底加 4px 蓝色左肩线,页脚小字用 #4fc3f7 亮蓝。
抬头这块渐变带的配色梯度值得留意一句:起点的 #01579B 是很深的海蓝,终点 #03A9F4 是明亮的天蓝,135 度对角渐变从左上深到右下浅;标题、编号、机构三行文字全压在白字上,只用 #e1f5fe 极浅蓝做小字与主标题的层次差。渐变跨度大时,白色小字在浅端(右下角)的对比度是靠 #e1f5fe 这种"浅但不满"的颜色撑住的——换成纯白小字在浅蓝天底上会糊,换成灰色小字又压不住深蓝端,#e1f5fe 在两头都站得住。这套抬头配色在三档蓝之间只动了一个变量(明度),改模板配色时照这个思路调,比东改一个色值西改一个色值稳。
终点站:PDF 里它长什么样
客户C 这条数据最终在 PDF 第二屏出现:左半边一颗 410 量级的红色气泡压在坐标 (9, 6.8) 上,名字可读;右边面板四条评分分数齐全;再往下综合评价卡的 AAA 结论收尾。评审从气泡图上直接得到"高敞口客户集中在高账龄高逾期区间"的判断,面板分数和评价卡给出结论闭环——四个维度的编码在这一页全部兑现。
整页的阅读动线也顺:抬头定基调,信息表核对主体,财务表看经营数字,气泡图把风险维度补上,说明面板给分数,评价卡下结论。气泡图放在财务表之后不是随便排的——先看过营收净利润的规模,再看敞口 120 到 560 万元的量级才有参照系,敞口数字和营收数字在同一个量级世界里,图读起来不悬空。若把气泡图提到信息表前面,评审带着"这公司是谁"的疑问读图,注意力反而散了。
复现清单
- 依赖
io.github.paohaijiao:jquick-pdfx:4.7.0+(Apache-2.0 协议); bubblePoint组装 Map:x(类目字符串)、y(数值)、size(敞口)、category、name、color 六键;ScatterSeries收 Object 数组,JOption.series()挂载;CategoryAxis/ValueAxis挂轴名,legend()三项对齐 category 取值,title().text().subtext()链式写副标题;JChartType.Bubble渲染 SVG,气泡颜色用带 alpha 的Color(三档 180);setFlexLayout(true)后bind("svg", svg),executeResource出D:\test\creditreport\14_bubble.pdf。
完整源码附录
/*
 * Licensed under the Apache License, Version 2.0 (the "License");
 * you may not use this file except in compliance with the License.
 * You may obtain a copy of the License at
 *
 *     http://www.apache.org/licenses/LICENSE-2.0
 *
 * Unless required by applicable law or agreed to in writing, software
 * distributed under the License is distributed on an "AS IS" BASIS,
 * WITHOUT WARRANTIES OR CONDITIONS OF ANY KIND, either express or implied.
 * See the License for the specific language governing permissions and
 * limitations under the License.
 *
 * Copyright (c) [2025-2099] Martin (goudingcheng@gmail.com)
 */
package com.github.paohaijiao.biz.report;

import com.github.paohaijiao.JOption;
import com.github.paohaijiao.bubble.CategoryAxis;
import com.github.paohaijiao.bubble.ScatterSeries;
import com.github.paohaijiao.bubble.ValueAxis;
import com.github.paohaijiao.config.JPdfConfig;
import com.github.paohaijiao.demo.constant.JQuickConstant;
import com.github.paohaijiao.enums.JChartType;
import com.github.paohaijiao.executor.JQuickPdfFactory;
import com.github.paohaijiao.factory.JChartRendererFactory;
import org.junit.Test;

import java.awt.Color;
import java.io.File;
import java.io.FileOutputStream;
import java.io.IOException;
import java.util.ArrayList;
import java.util.HashMap;
import java.util.List;
import java.util.Map;

/**
 * 统一信用报告 —— 风格 14:气泡图(浅蓝)
 *
 * <p>以 {@code report/credit_report_14_bubble.txt} 为模板,把气泡图渲染成 SVG 后
 * 绑定到模板中的 {@code ${svg}} 占位符,输出到 {@code D:\test\creditreport\14_bubble.pdf}。</p>
 *
 * @author Martin
 * @version 1.0.0
 */
public class JQuickCreditReport14BubbleTest {


    public static final String path = JQuickConstant.path;

    @Test
    public void report14Bubble() throws IOException {

        JOption option = new JOption();
        option.title().text("风险气泡分布").subtext("气泡大小代表风险敞口,颜色代表风险等级");
        option.legend("低风险", "中风险", "高风险");
        option.xAxis(new CategoryAxis().name("账龄(月)"));
        option.yAxis(new ValueAxis().name("逾期率(%)"));
        ScatterSeries series = new ScatterSeries("风险敞口");
        List<Map<String, Object>> seriesData = new ArrayList<>();
        seriesData.add(bubblePoint("客户A", "3", 1.2, 120, "低风险"));
        seriesData.add(bubblePoint("客户B", "6", 3.5, 260, "中风险"));
        seriesData.add(bubblePoint("客户C", "9", 6.8, 410, "高风险"));
        seriesData.add(bubblePoint("客户D", "4", 2.1, 180, "低风险"));
        seriesData.add(bubblePoint("客户E", "12", 9.4, 560, "高风险"));
        seriesData.add(bubblePoint("客户F", "8", 5.2, 330, "中风险"));
        series.data(seriesData.toArray());
        option.series(series);

        String svg = JChartRendererFactory.renderChart(JChartType.Bubble, option);

        File dir = new File(path + "creditreport");
        if (!dir.exists()) {

            dir.mkdirs();
        }
        FileOutputStream fileOutputStream = new FileOutputStream(path + "creditreport/14_bubble.pdf");
        JPdfConfig config = new JPdfConfig();
        // 开启 flex 行布局:图表与其右侧的指标说明面板在宽度允许时并排,而不是换行堆叠。
        config.getLayoutConfig().setFlexLayout(true);
        JQuickPdfFactory factory = new JQuickPdfFactory(config);
        factory.bind("svg", svg);
        byte[] bytes = factory.executeResource("report/credit_report_14_bubble.txt");
        fileOutputStream.write(bytes);
        fileOutputStream.close();
    }

    private static Map<String, Object> bubblePoint(String name, String x, double y, double size, String category) {

        Map<String, Object> point = new HashMap<>();
        point.put("x", x);
        point.put("y", y);
        point.put("size", size);
        point.put("category", category);
        point.put("name", name);
        point.put("color", bubbleColor(category));
        return point;
    }

    private static Color bubbleColor(String category) {

        if ("低风险".equals(category)) {

            return new Color(2, 136, 209, 180);
        }
        if ("中风险".equals(category)) {

            return new Color(255, 167, 38, 180);
        }
        return new Color(229, 57, 53, 180);
    }
}
<pdf>
<body>
  <div style="background:linear-gradient(135deg, #01579B 0%, #03A9F4 100%); borderRadius:8px; padding:18px; marginBottom:12px">
    <h1 style="textAlignment:center; color:white; fontSize:21; bold:true; marginBottom:8px">'企业信用评级报告'</h1>
    <p style="textAlignment:center; color:#e1f5fe; fontSize:10; margin:2px">'报告编号: CR-2023-08975  |  评估日期: 2023年11月15日'</p>
    <p style="textAlignment:center; color:#e1f5fe; fontSize:10; margin:2px">'评估机构: 四川省企业信用评估中心'</p>
  </div>

  <div style="marginBottom:14px">
    <table style="width:600px; fontSize:10">
      <tr>
        <th style="width:150px; padding:6px; backgroundColor:#0288D1; color:white; textAlignment:center">'企业名称'</th>
        <th style="padding:6px; backgroundColor:#0288D1; color:white; textAlignment:left">'四川省泡海椒科技有限公司'</th>
      </tr>
      <tr>
        <td style="width:150px; padding:6px; backgroundColor:#e1f5fe; bold:true">'统一信用代码'</td>
        <td style="padding:6px">'91110108MA01XX1234'</td>
      </tr>
      <tr>
        <td style="padding:6px; backgroundColor:#e1f5fe; bold:true">'成立日期'</td>
        <td style="padding:6px">'2018年5月20日'</td>
      </tr>
      <tr>
        <td style="padding:6px; backgroundColor:#e1f5fe; bold:true">'注册资本'</td>
        <td style="padding:6px">'1000万元人民币'</td>
      </tr>
      <tr>
        <td style="padding:6px; backgroundColor:#e1f5fe; bold:true">'法定代表人'</td>
        <td style="padding:6px">'泡海椒'</td>
      </tr>
      <tr>
        <td style="padding:6px; backgroundColor:#e1f5fe; bold:true">'所属行业'</td>
        <td style="padding:6px">'软件和信息技术服务业'</td>
      </tr>
      <tr>
        <td style="padding:6px; backgroundColor:#e1f5fe; bold:true">'企业规模'</td>
        <td style="padding:6px">'中型(150-200人)'</td>
      </tr>
    </table>
  </div>

  <div style="marginBottom:14px">
    <h2 style="color:#01579B; fontSize:13; bold:true; marginBottom:10px">'历年财务数据(单位:万元)'</h2>
    <table style="width:600px; fontSize:10">
      <tr>
        <th style="backgroundColor:#0288D1; color:white; padding:6px; textAlignment:center">'财务指标'</th>
        <th style="backgroundColor:#0288D1; color:white; padding:6px; textAlignment:center">'2020年'</th>
        <th style="backgroundColor:#0288D1; color:white; padding:6px; textAlignment:center">'2021年'</th>
        <th style="backgroundColor:#0288D1; color:white; padding:6px; textAlignment:center">'2022年'</th>
        <th style="backgroundColor:#0288D1; color:white; padding:6px; textAlignment:center">'2023年'</th>
        <th style="backgroundColor:#0288D1; color:white; padding:6px; textAlignment:center">'增长率'</th>
      </tr>
      <tr>
        <td style="padding:5px; bold:true; borderBottom:1px solid #b3e5fc">'营业收入'</td>
        <td style="padding:5px; textAlignment:right; borderBottom:1px solid #b3e5fc">'8,560'</td>
        <td style="padding:5px; textAlignment:right; borderBottom:1px solid #b3e5fc">'12,340'</td>
        <td style="padding:5px; textAlignment:right; borderBottom:1px solid #b3e5fc">'18,920'</td>
        <td style="padding:5px; textAlignment:right; borderBottom:1px solid #b3e5fc">'25,680'</td>
        <td style="padding:5px; textAlignment:right; borderBottom:1px solid #b3e5fc; color:#2e7d32; bold:true">'+44.2%'</td>
      </tr>
      <tr>
        <td style="padding:5px; bold:true; backgroundColor:#f2fafd; borderBottom:1px solid #b3e5fc">'净利润'</td>
        <td style="padding:5px; textAlignment:right; backgroundColor:#f2fafd; borderBottom:1px solid #b3e5fc">'1,240'</td>
        <td style="padding:5px; textAlignment:right; backgroundColor:#f2fafd; borderBottom:1px solid #b3e5fc">'2,150'</td>
        <td style="padding:5px; textAlignment:right; backgroundColor:#f2fafd; borderBottom:1px solid #b3e5fc">'3,890'</td>
        <td style="padding:5px; textAlignment:right; backgroundColor:#f2fafd; borderBottom:1px solid #b3e5fc">'5,420'</td>
        <td style="padding:5px; textAlignment:right; backgroundColor:#f2fafd; borderBottom:1px solid #b3e5fc; color:#2e7d32; bold:true">'+63.8%'</td>
      </tr>
      <tr>
        <td style="padding:5px; bold:true; borderBottom:1px solid #b3e5fc">'总资产'</td>
        <td style="padding:5px; textAlignment:right; borderBottom:1px solid #b3e5fc">'15,800'</td>
        <td style="padding:5px; textAlignment:right; borderBottom:1px solid #b3e5fc">'22,450'</td>
        <td style="padding:5px; textAlignment:right; borderBottom:1px solid #b3e5fc">'31,200'</td>
        <td style="padding:5px; textAlignment:right; borderBottom:1px solid #b3e5fc">'42,800'</td>
        <td style="padding:5px; textAlignment:right; borderBottom:1px solid #b3e5fc; color:#2e7d32; bold:true">'+39.5%'</td>
      </tr>
      <tr>
        <td style="padding:5px; bold:true; backgroundColor:#f2fafd; borderBottom:1px solid #b3e5fc">'净资产'</td>
        <td style="padding:5px; textAlignment:right; backgroundColor:#f2fafd; borderBottom:1px solid #b3e5fc">'9,200'</td>
        <td style="padding:5px; textAlignment:right; backgroundColor:#f2fafd; borderBottom:1px solid #b3e5fc">'13,800'</td>
        <td style="padding:5px; textAlignment:right; backgroundColor:#f2fafd; borderBottom:1px solid #b3e5fc">'19,500'</td>
        <td style="padding:5px; textAlignment:right; backgroundColor:#f2fafd; borderBottom:1px solid #b3e5fc">'26,400'</td>
        <td style="padding:5px; textAlignment:right; backgroundColor:#f2fafd; borderBottom:1px solid #b3e5fc; color:#2e7d32; bold:true">'+42.1%'</td>
      </tr>
      <tr>
        <td style="padding:5px; bold:true; borderBottom:1px solid #b3e5fc">'毛利率'</td>
        <td style="padding:5px; textAlignment:right; borderBottom:1px solid #b3e5fc">'42.5%'</td>
        <td style="padding:5px; textAlignment:right; borderBottom:1px solid #b3e5fc">'45.8%'</td>
        <td style="padding:5px; textAlignment:right; borderBottom:1px solid #b3e5fc">'48.2%'</td>
        <td style="padding:5px; textAlignment:right; borderBottom:1px solid #b3e5fc">'51.6%'</td>
        <td style="padding:5px; textAlignment:right; borderBottom:1px solid #b3e5fc; color:#2e7d32; bold:true">'+9.1%'</td>
      </tr>
    </table>
  </div>

  <div style="marginBottom:14px">
    <h2 style="color:#01579B; fontSize:13; bold:true; marginBottom:10px">'关键经营指标'</h2>
    <div style="display:flex; marginBottom:9px">
      <div style="width:22px; paddingTop:3px">
        <div style="width:10px; height:10px; borderRadius:5px; backgroundColor:#03A9F4"></div>
      </div>
      <div style="width:560px; fontSize:11">
        <span style="bold:true; color:#01579B">'营收增长率: '</span>
        '连续三年保持40%以上增长,2023年达到25,680万元'
      </div>
    </div>
    <div style="display:flex; marginBottom:9px">
      <div style="width:22px; paddingTop:3px">
        <div style="width:10px; height:10px; borderRadius:5px; backgroundColor:#03A9F4"></div>
      </div>
      <div style="width:560px; fontSize:11">
        <span style="bold:true; color:#01579B">'利润率提升: '</span>
        '净利率从14.5%提升至21.1%,盈利能力显著增强'
      </div>
    </div>
    <div style="display:flex; marginBottom:9px">
      <div style="width:22px; paddingTop:3px">
        <div style="width:10px; height:10px; borderRadius:5px; backgroundColor:#03A9F4"></div>
      </div>
      <div style="width:560px; fontSize:11">
        <span style="bold:true; color:#01579B">'研发投入: '</span>
        '研发费用年均增长38.9%,占营收比例达13.3%'
      </div>
    </div>
    <div style="display:flex; marginBottom:9px">
      <div style="width:22px; paddingTop:3px">
        <div style="width:10px; height:10px; borderRadius:5px; backgroundColor:#03A9F4"></div>
      </div>
      <div style="width:560px; fontSize:11">
        <span style="bold:true; color:#01579B">'人才结构: '</span>
        '技术研发人员占比42%,硕士以上学历占35%'
      </div>
    </div>
    <div style="display:flex; marginBottom:9px">
      <div style="width:22px; paddingTop:3px">
        <div style="width:10px; height:10px; borderRadius:5px; backgroundColor:#03A9F4"></div>
      </div>
      <div style="width:560px; fontSize:11">
        <span style="bold:true; color:#01579B">'客户质量: '</span>
        '服务15家上市公司,客户续约率92%,大客户满意度4.8/5.0'
      </div>
    </div>
    <div style="display:flex; marginBottom:9px">
      <div style="width:22px; paddingTop:3px">
        <div style="width:10px; height:10px; borderRadius:5px; backgroundColor:#03A9F4"></div>
      </div>
      <div style="width:560px; fontSize:11">
        <span style="bold:true; color:#01579B">'资产质量: '</span>
        '资产负债率维持在38%左右,流动比率2.8,偿债能力良好'
      </div>
    </div>
  </div>

  <div style="marginBottom:14px">
    <h2 style="color:#01579B; fontSize:13; bold:true; marginBottom:10px">'风险气泡分布图'</h2>
    <div style="display:flex; justifyContent:space-between">
      <svg style="width:390px;height:400px">${svg}</svg>
      <div style="width:300px; backgroundColor:#e1f5fe; borderRadius:6px; padding:12px">
        <h3 style="color:#01579B; fontSize:12; bold:true; marginBottom:8px">'评级指标说明'</h3>
        <div style="fontSize:10; marginBottom:6px">
          <span style="bold:true; color:#0288D1">'财务状况(90分): '</span>
          '营收稳定增长'
        </div>
        <div style="fontSize:10; marginBottom:6px">
          <span style="bold:true; color:#0288D1">'经营能力(95分): '</span>
          '客户留存率高'
        </div>
        <div style="fontSize:10; marginBottom:6px">
          <span style="bold:true; color:#0288D1">'偿债能力(85分): '</span>
          '负债率合理'
        </div>
        <div style="fontSize:10; marginBottom:6px">
          <span style="bold:true; color:#0288D1">'发展潜力(92分): '</span>
          '研发投入增加'
        </div>
      </div>
    </div>
  </div>

  <div style="marginBottom:14px; backgroundColor:#e1f5fe; borderRadius:8px; padding:16px; borderLeft:4px solid #0288D1">
    <h2 style="color:#01579B; fontSize:13; bold:true; marginBottom:8px">'综合评价'</h2>
    <p style="textAlignment:justify; fontSize:11">
      '四川省泡海椒科技有限公司作为国家级高新技术企业和专精特新"小巨人"企业,在云计算和大数据领域表现出色。公司财务状况健康,经营能力突出,技术创新能力强,具备良好的发展潜力。信用评级为AAA级,展望稳定。'
    </p>
  </div>

  <div style="textAlignment:center; marginTop:12px">
    <p style="fontSize:9; color:#4fc3f7">'本报告依据公开信息和专业评估模型生成,仅供参考 | 报告生成时间: 2025年09月06日'</p>
    <p style="fontSize:9; color:#4fc3f7">'© 2023 企业信用评估中心 版权所有 | 认证编号: CE-2023-001'</p>
  </div>
</body>
</pdf>