3-1 低阶API示范
网络异常,图片无法展示
|
下面的范例使用TensorFlow的低阶API实现线性回归模型和DNN二分类模型。
低阶API主要包括张量操作,计算图和自动微分。
首先我们可以定义一个打印时间分割线的函数,可以方便后面可视化打印的时间
import tensorflow as tf
#打印时间分割线
@tf.function
def printbar():
    today_ts = tf.timestamp()%(24*60*60)
    hour = tf.cast(today_ts//3600+8,tf.int32)%tf.constant(24)
    minite = tf.cast((today_ts%3600)//60,tf.int32)
    second = tf.cast(tf.floor(today_ts%60),tf.int32)
    def timeformat(m):
        if tf.strings.length(tf.strings.format("{}",m))==1:
            return(tf.strings.format("0{}",m))
        else:
            return(tf.strings.format("{}",m))
    timestring = tf.strings.join([timeformat(hour),timeformat(minite),
                timeformat(second)],separator = ":")
    tf.print("=========="*8+timestring)
一,线性回归模型
我们接下来以线性回归模型作为一个例子
1,准备数据
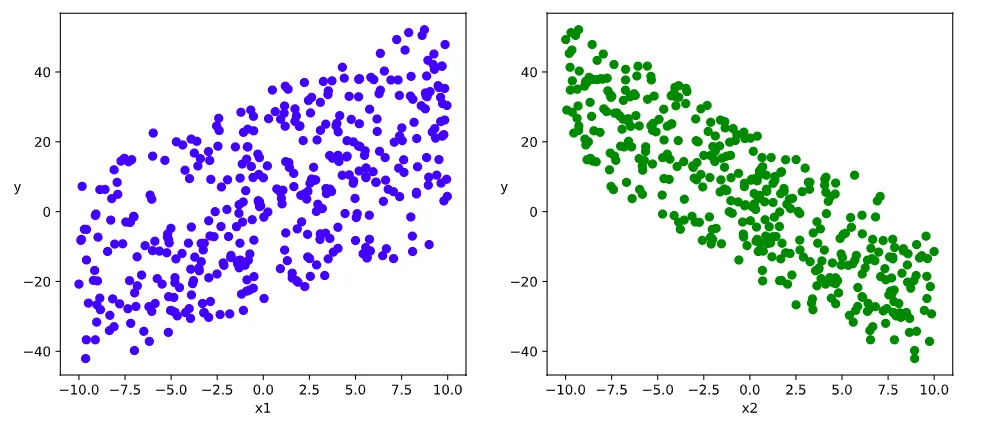
首先我们得先准备数据,我们可以用tensorflow来生成随机数,由于我们是线性回归,我们就可以利用矩阵乘法生成,并且加入一些正态扰动即可
import numpy as np
import pandas as pd
from matplotlib import pyplot as plt
import tensorflow as tf
#样本数量
n = 400
# 生成测试用数据集
X = tf.random.uniform([n,2],minval=-10,maxval=10)
w0 = tf.constant([[2.0],[-3.0]])
b0 = tf.constant([[3.0]])
Y = X@w0 + b0 + tf.random.normal([n,1],mean = 0.0,stddev= 2.0)  # @表示矩阵乘法,增加正态扰动
# 数据可视化
%matplotlib inline
%config InlineBackend.figure_format = 'svg'
plt.figure(figsize = (12,5))
ax1 = plt.subplot(121)
ax1.scatter(X[:,0],Y[:,0], c = "b")
plt.xlabel("x1")
plt.ylabel("y",rotation = 0)
ax2 = plt.subplot(122)
ax2.scatter(X[:,1],Y[:,0], c = "g")
plt.xlabel("x2")
plt.ylabel("y",rotation = 0)
plt.show()
接着我们利用tensorflow来构建数据管道迭代器,并且之后样本的读取数据是随机的
# 构建数据管道迭代器
def data_iter(features, labels, batch_size=8):
    num_examples = len(features)
    indices = list(range(num_examples))
    np.random.shuffle(indices)  #样本的读取顺序是随机的
    for i in range(0, num_examples, batch_size):
        indexs = indices[i: min(i + batch_size, num_examples)]
        yield tf.gather(features,indexs), tf.gather(labels,indexs)
# 测试数据管道效果
batch_size = 8
(features,labels) = next(data_iter(X,Y,batch_size))
print(features)
print(labels)
tf.Tensor(
[[ 2.6161194   0.11071014]
 [ 9.79207    -0.70180416]
 [ 9.792343    6.9149055 ]
 [-2.4186516  -9.375019  ]
 [ 9.83749    -3.4637213 ]
 [ 7.3953056   4.374569  ]
 [-0.14686584 -0.28063297]
 [ 0.49001217 -9.739792  ]], shape=(8, 2), dtype=float32)
tf.Tensor(
[[ 9.334667 ]
 [22.058844 ]
 [ 3.0695205]
 [26.736238 ]
 [35.292133 ]
 [ 4.2943544]
 [ 1.6713585]
 [34.826904 ]], shape=(8, 1), dtype=float32)
我们可以看到,我们得到了我们想要的结果
2,定义模型
之后则是定义我们的模型,定义一个线性回归模型,根据y=wx+b,同时初始化我们的权重w和偏置b
w = tf.Variable(tf.random.normal(w0.shape))
b = tf.Variable(tf.zeros_like(b0,dtype = tf.float32))
# 定义模型
class LinearRegression:
    #正向传播
    def __call__(self,x):
        return x@w + b
    # 损失函数
    def loss_func(self,y_true,y_pred):
        return tf.reduce_mean((y_true - y_pred)**2/2)
model = LinearRegression()
3,训练模型
之后我们就可以开始训练模型,我们可以利用动态图进行调试,首先得到我们的损失,然后再通过反向传播求解我们梯度,再利用梯度下降法更新参数。
# 使用动态图调试
def train_step(model, features, labels):
    with tf.GradientTape() as tape:
        predictions = model(features)
        loss = model.loss_func(labels, predictions)
    # 反向传播求梯度
    dloss_dw,dloss_db = tape.gradient(loss,[w,b])
    # 梯度下降法更新参数
    w.assign(w - 0.001*dloss_dw)
    b.assign(b - 0.001*dloss_db)
    return loss
最后我们可以得到我们的结果
# 测试train_step效果
batch_size = 10
(features,labels) = next(data_iter(X,Y,batch_size))
train_step(model,features,labels)
<tf.Tensor: shape=(), dtype=float32, numpy=211.09982>
def train_model(model,epochs):
    for epoch in tf.range(1,epochs+1):
        for features, labels in data_iter(X,Y,10):
            loss = train_step(model,features,labels)
        if epoch%50==0:
            printbar()
            tf.print("epoch =",epoch,"loss = ",loss)
            tf.print("w =",w)
            tf.print("b =",b)
train_model(model,epochs = 200)
以下内容可以看到我们的训练过程
================================================================================16:35:56
epoch = 50 loss =  1.78806472
w = [[1.97554708]
 [-2.97719598]]
b = [[2.60692883]]
================================================================================16:36:00
epoch = 100 loss =  2.64588404
w = [[1.97319281]
 [-2.97810626]]
b = [[2.95525956]]
================================================================================16:36:04
epoch = 150 loss =  1.42576694
w = [[1.96466208]
 [-2.98337793]]
b = [[3.00264144]]
================================================================================16:36:08
epoch = 200 loss =  1.68992615
w = [[1.97718477]
 [-2.983814]]
b = [[3.01013041]]
##使用autograph机制转换成静态图加速
@tf.function
def train_step(model, features, labels):
    with tf.GradientTape() as tape:
        predictions = model(features)
        loss = model.loss_func(labels, predictions)
    # 反向传播求梯度
    dloss_dw,dloss_db = tape.gradient(loss,[w,b])
    # 梯度下降法更新参数
    w.assign(w - 0.001*dloss_dw)
    b.assign(b - 0.001*dloss_db)
    return loss
def train_model(model,epochs):
    for epoch in tf.range(1,epochs+1):
        for features, labels in data_iter(X,Y,10):
            loss = train_step(model,features,labels)
        if epoch%50==0:
            printbar()
            tf.print("epoch =",epoch,"loss = ",loss)
            tf.print("w =",w)
            tf.print("b =",b)
train_model(model,epochs = 200)
================================================================================16:36:35
epoch = 50 loss =  0.894210339
w = [[1.96927285]
 [-2.98914337]]
b = [[3.00987792]]
================================================================================16:36:36
epoch = 100 loss =  1.58621466
w = [[1.97566223]
 [-2.98550248]]
b = [[3.00998402]]
================================================================================16:36:37
epoch = 150 loss =  2.2695992
w = [[1.96664226]
 [-2.99248481]]
b = [[3.01028705]]
================================================================================16:36:38
epoch = 200 loss =  1.90848124
w = [[1.98000824]
 [-2.98888135]]
b = [[3.01085401]]
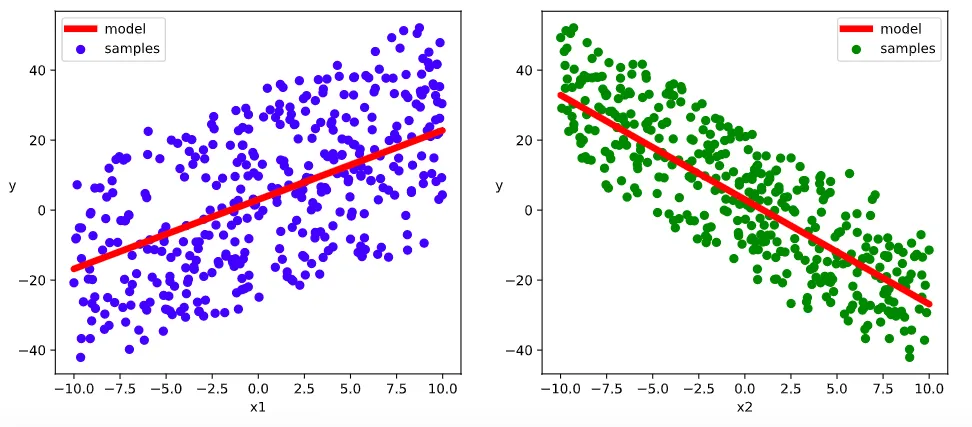
我们还可以可视化我们的结果,利用线性回归分类得到一条直线
# 结果可视化
%matplotlib inline
%config InlineBackend.figure_format = 'svg'
plt.figure(figsize = (12,5))
ax1 = plt.subplot(121)
ax1.scatter(X[:,0],Y[:,0], c = "b",label = "samples")
ax1.plot(X[:,0],w[0]*X[:,0]+b[0],"-r",linewidth = 5.0,label = "model")
ax1.legend()
plt.xlabel("x1")
plt.ylabel("y",rotation = 0)
ax2 = plt.subplot(122)
ax2.scatter(X[:,1],Y[:,0], c = "g",label = "samples")
ax2.plot(X[:,1],w[1]*X[:,1]+b[0],"-r",linewidth = 5.0,label = "model")
ax2.legend()
plt.xlabel("x2")
plt.ylabel("y",rotation = 0)
plt.show()
二,DNN二分类模型
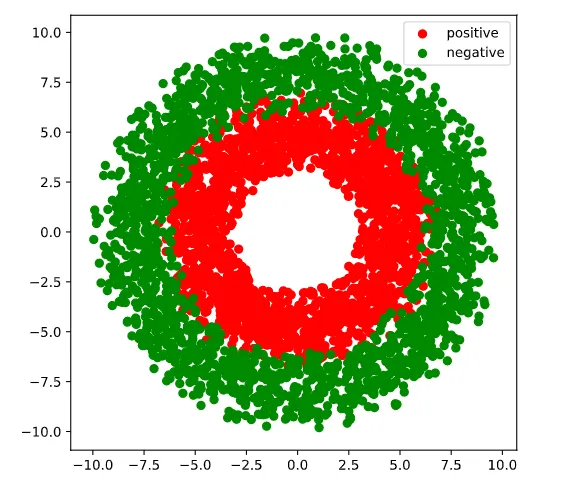
这里和前面有些类似,首先我们利用tensorflow的random函数来得到我们的数据
- 生成正样本, 小圆环分布
- 生成负样本, 大圆环分布
生成后也可以可视化,对数据的分布有一个更好的理解
1,准备数据
import numpy as np
import pandas as pd
from matplotlib import pyplot as plt
import tensorflow as tf
%matplotlib inline
%config InlineBackend.figure_format = 'svg'
#正负样本数量
n_positive,n_negative = 2000,2000
#生成正样本, 小圆环分布
r_p = 5.0 + tf.random.truncated_normal([n_positive,1],0.0,1.0)
theta_p = tf.random.uniform([n_positive,1],0.0,2*np.pi)
Xp = tf.concat([r_p*tf.cos(theta_p),r_p*tf.sin(theta_p)],axis = 1)
Yp = tf.ones_like(r_p)
#生成负样本, 大圆环分布
r_n = 8.0 + tf.random.truncated_normal([n_negative,1],0.0,1.0)
theta_n = tf.random.uniform([n_negative,1],0.0,2*np.pi)
Xn = tf.concat([r_n*tf.cos(theta_n),r_n*tf.sin(theta_n)],axis = 1)
Yn = tf.zeros_like(r_n)
#汇总样本
X = tf.concat([Xp,Xn],axis = 0)
Y = tf.concat([Yp,Yn],axis = 0)
#可视化
plt.figure(figsize = (6,6))
plt.scatter(Xp[:,0].numpy(),Xp[:,1].numpy(),c = "r")
plt.scatter(Xn[:,0].numpy(),Xn[:,1].numpy(),c = "g")
plt.legend(["positive","negative"]);
这里再次构建数据管道迭代器
# 构建数据管道迭代器
def data_iter(features, labels, batch_size=8):
    num_examples = len(features)
    indices = list(range(num_examples))
    np.random.shuffle(indices)  #样本的读取顺序是随机的
    for i in range(0, num_examples, batch_size):
        indexs = indices[i: min(i + batch_size, num_examples)]
        yield tf.gather(features,indexs), tf.gather(labels,indexs)
# 测试数据管道效果
batch_size = 10
(features,labels) = next(data_iter(X,Y,batch_size))
print(features)
print(labels)
tf.Tensor(
[[ 0.03732629  3.5783494 ]
 [ 0.542919    5.035079  ]
 [ 5.860281   -2.4476354 ]
 [ 0.63657564  3.194231  ]
 [-3.5072308   2.5578873 ]
 [-2.4109735  -3.6621518 ]
 [ 4.0975413  -2.4172943 ]
 [ 1.9393908  -6.782317  ]
 [-4.7453732  -0.5176727 ]
 [-1.4057113  -7.9775257 ]], shape=(10, 2), dtype=float32)
tf.Tensor(
[[1.]
 [1.]
 [0.]
 [1.]
 [1.]
 [1.]
 [1.]
 [0.]
 [1.]
 [0.]], shape=(10, 1), dtype=float32)
2,定义模型
此处范例我们利用tf.Module来组织模型变量,关于tf.Module的较详细介绍参考4.6 Autograph和tf.Module。
class DNNModel(tf.Module):
    def __init__(self,name = None):
        super(DNNModel, self).__init__(name=name)
        self.w1 = tf.Variable(tf.random.truncated_normal([2,4]),dtype = tf.float32)
        self.b1 = tf.Variable(tf.zeros([1,4]),dtype = tf.float32)
        self.w2 = tf.Variable(tf.random.truncated_normal([4,8]),dtype = tf.float32)
        self.b2 = tf.Variable(tf.zeros([1,8]),dtype = tf.float32)
        self.w3 = tf.Variable(tf.random.truncated_normal([8,1]),dtype = tf.float32)
        self.b3 = tf.Variable(tf.zeros([1,1]),dtype = tf.float32)
    # 正向传播
    @tf.function(input_signature=[tf.TensorSpec(shape = [None,2], dtype = tf.float32)])
    def __call__(self,x):
        x = tf.nn.relu(x@self.w1 + self.b1)
        x = tf.nn.relu(x@self.w2 + self.b2)
        y = tf.nn.sigmoid(x@self.w3 + self.b3)
        return y
    # 损失函数(二元交叉熵)
    @tf.function(input_signature=[tf.TensorSpec(shape = [None,1], dtype = tf.float32),
                              tf.TensorSpec(shape = [None,1], dtype = tf.float32)])
    def loss_func(self,y_true,y_pred):
        #将预测值限制在 1e-7 以上, 1 - 1e-7 以下,避免log(0)错误
        eps = 1e-7
        y_pred = tf.clip_by_value(y_pred,eps,1.0-eps)
        bce = - y_true*tf.math.log(y_pred) - (1-y_true)*tf.math.log(1-y_pred)
        return  tf.reduce_mean(bce)
    # 评估指标(准确率)
    @tf.function(input_signature=[tf.TensorSpec(shape = [None,1], dtype = tf.float32),
                              tf.TensorSpec(shape = [None,1], dtype = tf.float32)])
    def metric_func(self,y_true,y_pred):
        y_pred = tf.where(y_pred>0.5,tf.ones_like(y_pred,dtype = tf.float32),
                          tf.zeros_like(y_pred,dtype = tf.float32))
        acc = tf.reduce_mean(1-tf.abs(y_true-y_pred))
        return acc
model = DNNModel()
# 测试模型结构
batch_size = 10
(features,labels) = next(data_iter(X,Y,batch_size))
predictions = model(features)
loss = model.loss_func(labels,predictions)
metric = model.metric_func(labels,predictions)
tf.print("init loss:",loss)
tf.print("init metric",metric)
init loss: 1.76568353
init metric 0.6
print(len(model.trainable_variables))
6
3,训练模型
##使用autograph机制转换成静态图加速
@tf.function
def train_step(model, features, labels):
    # 正向传播求损失
    with tf.GradientTape() as tape:
        predictions = model(features)
        loss = model.loss_func(labels, predictions)
    # 反向传播求梯度
    grads = tape.gradient(loss, model.trainable_variables)
    # 执行梯度下降
    for p, dloss_dp in zip(model.trainable_variables,grads):
        p.assign(p - 0.001*dloss_dp)
    # 计算评估指标
    metric = model.metric_func(labels,predictions)
    return loss, metric
def train_model(model,epochs):
    for epoch in tf.range(1,epochs+1):
        for features, labels in data_iter(X,Y,100):
            loss,metric = train_step(model,features,labels)
        if epoch%100==0:
            printbar()
            tf.print("epoch =",epoch,"loss = ",loss, "accuracy = ", metric)
train_model(model,epochs = 600)
================================================================================16:47:35
epoch = 100 loss =  0.567795336 accuracy =  0.71
================================================================================16:47:39
epoch = 200 loss =  0.50955683 accuracy =  0.77
================================================================================16:47:43
epoch = 300 loss =  0.421476126 accuracy =  0.84
================================================================================16:47:47
epoch = 400 loss =  0.330618203 accuracy =  0.9
================================================================================16:47:51
epoch = 500 loss =  0.308296859 accuracy =  0.89
================================================================================16:47:55
epoch = 600 loss =  0.279367268 accuracy =  0.96
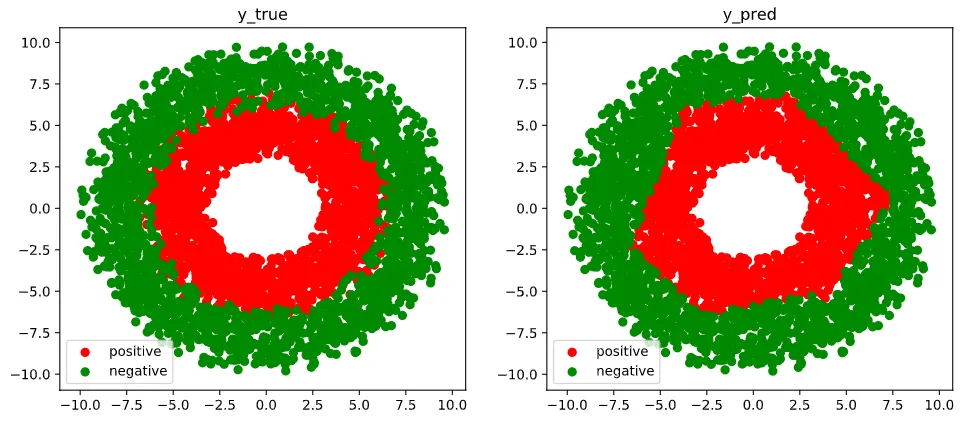
最后我们可以可视化我们的预测值和实际值的区别,我们可以看到结果还是很近人意的
# 结果可视化
fig, (ax1,ax2) = plt.subplots(nrows=1,ncols=2,figsize = (12,5))
ax1.scatter(Xp[:,0],Xp[:,1],c = "r")
ax1.scatter(Xn[:,0],Xn[:,1],c = "g")
ax1.legend(["positive","negative"]);
ax1.set_title("y_true");
Xp_pred = tf.boolean_mask(X,tf.squeeze(model(X)>=0.5),axis = 0)
Xn_pred = tf.boolean_mask(X,tf.squeeze(model(X)<0.5),axis = 0)
ax2.scatter(Xp_pred[:,0],Xp_pred[:,1],c = "r")
ax2.scatter(Xn_pred[:,0],Xn_pred[:,1],c = "g")
ax2.legend(["positive","negative"]);
ax2.set_title("y_pred");