怎么通过pandas获取作图的数据呢?
本问题来自阿里云开发者社区的【11大垂直技术领域开发者社群】。https://developer.aliyun.com/article/706511 点击链接欢迎加入感兴趣的技术领域群。
-

import sys import os import re import datetime import csv
def get_datetime(record): request_time = "" p = re.compile(r"(?P\d{4}-\d{2}-\d{2} \d{2}:\d{2}:\d{2},\d+)") # p = re.compile(r"(?P[\d.]+)ms") m = p.search(record) if m: request_time = m.group("time") dt = datetime.datetime.strptime(request_time, '%Y-%m-%d %H:%M:%S,%f') return dt
def parse(log_file_name, result_csv_name): start = 0 end = 0 start_time = '' end_time = '' md5crc32 = '' csv_writer = csv.writer(open(result_csv_name, 'wb'), delimiter = ',') with open(log_file_name, 'rb') as log_file: for i, line in enumerate(log_file): line = line.strip() if 'folderProcessing() INFO download from' in line: start = i start_time = get_datetime(line) elif 'DownLoadFile() INFO download to' in line: end = i end_time = get_datetime(line) # got one download action if end - start == 1: # parse hash md5crc32 = line.rsplit('/', 1)[1] print md5crc32, (end_time - start_time).total_seconds() csv_writer.writerow((md5crc32, (end_time - start_time).total_seconds())) # assert False
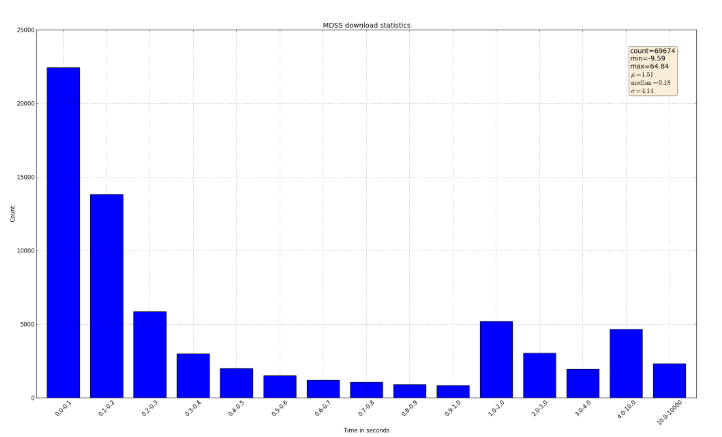
def do_statistics(file_name): import pandas as pd import numpy as np import matplotlib.pyplot as plt df = pd.read_csv(file_name, header = None, names= ['hash', 'time'], dtype = {'time': np.float64}, # nrows = 10000 ) time_series = df.time print time_series.describe() plt.figure() # fig = time_series.hist().get_figure() # define range ranges = (0.0, 0.1, 0.2, 0.3, 0.4, 0.5, 0.6, 0.7, 0.8, 0.9, 1.0, 2.0, 3.0, 4.0, 10.0, 10000) bins = zip(ranges[:-1], ranges[1:]) labels = ['%s-%s'%(begin, end) for i ,(begin, end) in enumerate(bins) ] print labels #print bins #fig = time_series.plot(kind='bar', xticks = ranges) results = [0] * len(bins) for i in time_series: for j , (begin, end) in enumerate(bins): if i > begin and i <= end: results[j] += 1 print results
mu = time_series.mean()
median = np.median(time_series)
sigma = time_series.std()

ax = pd.Series(results).plot(kind='bar', logy = True, figsize=(25, 13.5))
# dpi = ax.figure.get_dpi()
# print 'dpi = ', dpi
# plt.gcf().set_size_inches(25, 13.5)

ax.set_ylabel('Count')
ax.set_xlabel('Time in seconds')
# print dir(fig)
ax.set_xticklabels(labels, rotation = 45)
ax.set_title('MDSS download statistics')

textstr = 'count=%s\nmin=%.2f\nmax=%.2f\n$\mu=%.2f$\n$\mathrm{median}=%.2f$\n$\sigma=%.2f$'%(time_series.count(),time_series.min(), time_series.max(),mu, median, sigma)

# these are matplotlib.patch.Patch properties
props = dict(boxstyle='round', facecolor='wheat', alpha=0.5)

# place a text box in upper right in axes coords
ax.text(0.90, 0.95, textstr, transform=ax.transAxes, fontsize=14,
        verticalalignment='top', bbox=props)

ax.figure.show()
#
ax.figure.set_size_inches(25, 13.5, forward = True)
print ax.figure.get_size_inches()
ax.figure.savefig('result.png', format='png',)
input('asdfasd')
if name == "main": # print get_datetime("2014-10-23 09:19:34,251 pid=27850") # parse('inpri_p_antiy.log', 'result.csv') do_statistics('result.csv')
 2019-10-25 17:45:50赞同 展开评论 打赏
版权声明:本文内容由阿里云实名注册用户自发贡献,版权归原作者所有,阿里云开发者社区不拥有其著作权,亦不承担相应法律责任。具体规则请查看《阿里云开发者社区用户服务协议》和《阿里云开发者社区知识产权保护指引》。如果您发现本社区中有涉嫌抄袭的内容,填写侵权投诉表单进行举报,一经查实,本社区将立刻删除涉嫌侵权内容。