zend studio + xdebug +firefox的xdebug插件,
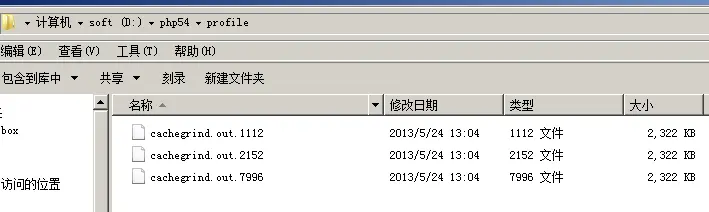
zend studio + xdebug +firefox的xdebug插件。 想对脚本进行profiling,看看性能。
但是zend studio就是没反应(不切换到profiling窗口, 窗口里空空如也。)。

xdebug配置
xdebug.remote_enable = On;
xdebug.remote_host = "localhost";
xdebug.remote_port= 9001;
xdebug.remote_handler = "dbgp";
xdebug.profile_enable = 0;
xdebug.profiler_enable_trigger = 1;
xdebug.profiler_output_dir = D:\php54\profile

用firebug的请求头发现cookie已经包含 XDEBUG_PROFILE=1
并且检查D:\php54\profile 里面也已经有xdebug生成的profiling文件

所以怀疑是zend studio的配置问题。 但找不到解决办法。

有人解决过这种问题么?
版权声明:本文内容由阿里云实名注册用户自发贡献,版权归原作者所有,阿里云开发者社区不拥有其著作权,亦不承担相应法律责任。具体规则请查看《阿里云开发者社区用户服务协议》和《阿里云开发者社区知识产权保护指引》。如果您发现本社区中有涉嫌抄袭的内容,填写侵权投诉表单进行举报,一经查实,本社区将立刻删除涉嫌侵权内容。
既然都用Zend Studio了,为什么还要用XDebug,Zend Debugger不是很好用吗?
我这里以Ubuntu为例,下载Zend Debugger: http://www.zend.com/en/products/studio/downloads 在/etc/php5/apache2/php.ini中加入 zend_extension=/usr/lib/php5/ZendDebugger.so zend_debugger.allow_hosts=127.0.0.1 其中/usr/lib/php5/ZendDebugger.so为你放置ZendDebugger.so的位置。 把ZendDebugger里的dummy.php拷到网站根目录/var/www/ sudo service apache2 restart 重启服务器 查看探针phpinfo,查找Zend Debugger验证安装成功。 ######zend debugger支持5.4么?######那个,php需要调试么?我以前也学过xdebug的用法,不过我也是完成了几个大型web项目,貌似都是不需要调试的,凭经验跟错误提示看的出来啊