The MOD16A2 V105 product provides information about 8-day global terrestrial evapotranspiration at 1km pixel resolution. Evapotranspiration (ET) is the sum of evaporation and plant transpiration from the Earth's surface to the atmosphere. With long-term ET data, the effects of changes in climate, land use, and ecosystems disturbances can be quantified.
The MOD16A2 product is produced by the Numerical Terradynamic Simulation Group NTSG, University of Montana (UMT) in conjunction with NASA Earth Observing System. For more details about the algorithm used see the algorithm theoretical basis document.
The period of coverage is 8 days with the exception of the last period at the end of the year which is either 5 or 6 days. ET/PET units are 0.1mm/5-day for December 27-31 of 2001, 2002, 2003, 2005, 2006, 2007, 2009, 2010, and 0.1mm/6-day for December 26-31 of 2000, 2004, 2008 (leap years). *For some pixels in African rainforest, the MODIS albedo data from MCD43B2/MCD43B3 have no cloud-free data throughout an entire year. As a result, pixels for that year in all data bands are masked out.
MOD16A2 V105产品以1公里的像素分辨率提供8天的全球陆地蒸发量信息。蒸发量(ET)是地球表面到大气中的蒸发量和植物蒸腾量的总和。有了长期的蒸散发数据,气候、土地利用和生态系统干扰的变化的影响就可以被量化。
MOD16A2产品是由蒙大拿大学(UMT)的NTSG数值地球动力学模拟小组与NASA地球观测系统共同制作的。关于所用算法的更多细节,请参见算法理论基础文件。
覆盖期为8天,除了年底的最后一个时期是5天或6天之外。2001、2002、2003、2005、2006、2007、2009、2010年12月27-31日的ET/PET单位为0.1毫米/5天,2000、2004、2008年12月26-31日(闰年)为0.1毫米/6天。*对于非洲雨林的一些像素,来自MCD43B2/MCD43B3的MODIS反照率数据在整个一年中没有无云数据。因此,所有数据波段中该年的像素都被掩盖了。
Dataset Availability
2000-01-01T00:00:00 - 2014-12-31T00:00:00
Dataset Provider
Numerical Terradynamic Simulation Group, The University of Montana
Collection Snippet
ee.ImageCollection("MODIS/NTSG/MOD16A2/105")
使用说明:
MODIS data and products acquired through the LP DAAC have no restrictions on subsequent use, sale, or redistribution.
Resolution
1000 meters
Bands Table
| Name | Description | Min* | Max* | Units | Scale |
| ET | Evapotranspiration, aggregated for period of coverage.* | -5 | 453 | kg/m^2 | 0.1 |
| LE | Latent heat flux, averaged daily over the period of coverage.* | -20 | 1671 | J/m^2/day | 0.0001 |
| PET | Potential evapotranspiration, aggregated for period of coverage.* | -8 | 793 | kg/m^2 | 0.1 |
| PLE | Potential Latent Heat Flux, averaged daily over the period ofcoverage.* | -40 | 3174 | J/m^2/day | 0.0001 |
| ET_QC | ET quality control. | 0 | |||
| ET_QC Bitmask |
|
||||
* = Values are estimated引用:
影像属性:
Name Type Description
days_of_coverage Double Number of days covered by each image since the period of coverage for the last asset of the year can be of varying length
使用说明:
All NTSG data distributed through this site has no restrictions on subsequent use, sale, or redistribution.
引用:
Qiaozhen Mu, Maosheng Zhao, Steven W. Running and Numerical Terradynamic Simulation Group (2014): MODIS Global Terrestrial Evapotranspiration (ET) Product MOD16A2 Collection 5.
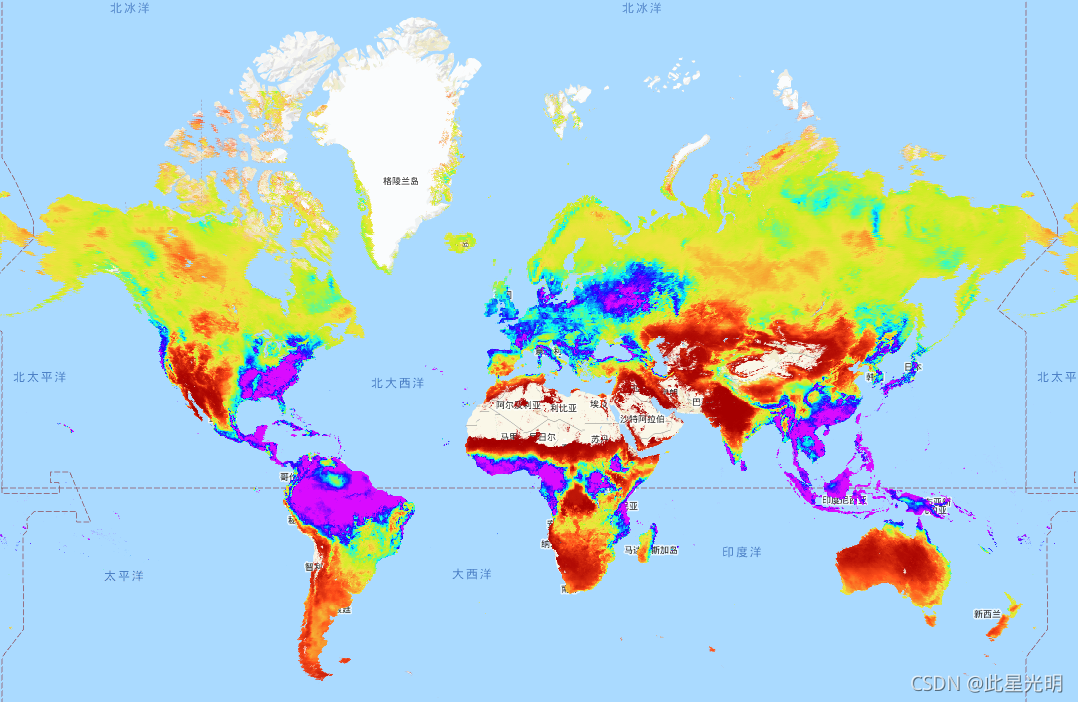
代码:
var dataset = ee.ImageCollection('MODIS/NTSG/MOD16A2/105')
                  .filter(ee.Filter.date('2014-04-01', '2014-06-01'));
var evapotranspiration = dataset.select('ET');
var evapotranspirationVis = {
  min: 0.0,
  max: 300.0,
  palette:
      ['a50000', 'ff4f1a', 'f1e342', 'c7ef1f', '05fff3', '1707ff', 'd90bff'],
};
Map.setCenter(6.746, 46.529, 2);
Map.addLayer(evapotranspiration, evapotranspirationVis, 'Evapotranspiration');