这个例子主要是讲解一下用美国犹他州和科罗拉多州进行区域筛选并且求当地影像的最大、最小、中位数以及平均数等等的运算,一起来看代码:
// Filter to only include images intersecting Colorado or Utah.
var polygon = ee.Geometry.Polygon({
  coords: [[[-109.05, 37.0], [-102.05, 37.0], [-102.05, 41.0], // Colorado
            [-109.05, 41.0], [-111.05, 41.0], [-111.05, 42.0], // Utah
            [-114.05, 42.0], [-114.05, 37.0], [-109.05, 37.0]]],
  geodesic: false
});
// Create a Landsat 7 composite for Spring of 2000, and filter by
// the bounds of the FeatureCollection.
var collection = ee.ImageCollection('LANDSAT/LE07/C01/T1')
    .filterDate('2000-04-01', '2000-07-01')
    .filterBounds(polygon);
// Compute the median in each band, in each pixel.自己可以去逐个均值、最大最小尝试!
var median = collection.max();
                       //.mean();
                       //.max();
                       //.median();
// Select the red, green and blue bands.
var result = median.select('B3', 'B2', 'B1');
Map.addLayer(result, {gain: [1.4, 1.4, 1.1]});
Map.setCenter(-110, 40, 5);
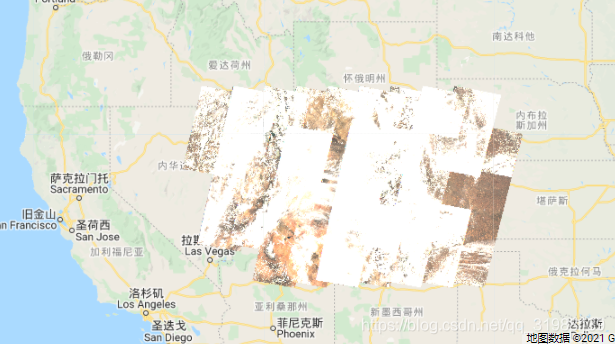
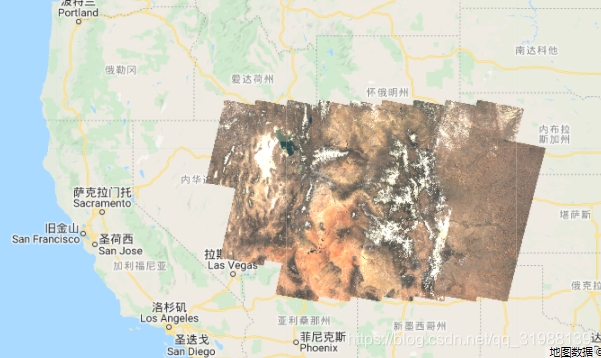
这张是.max()最大值效果,云层比较多
这张是.max()最大值效果,几乎无云
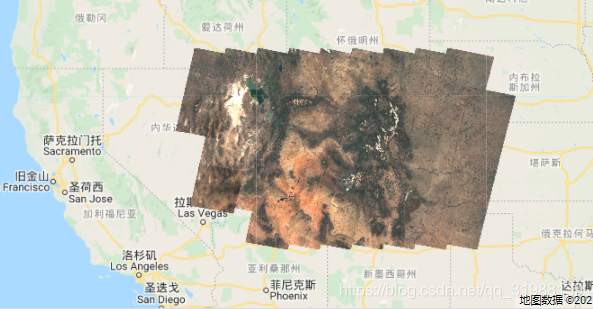
这张是.mean()效果
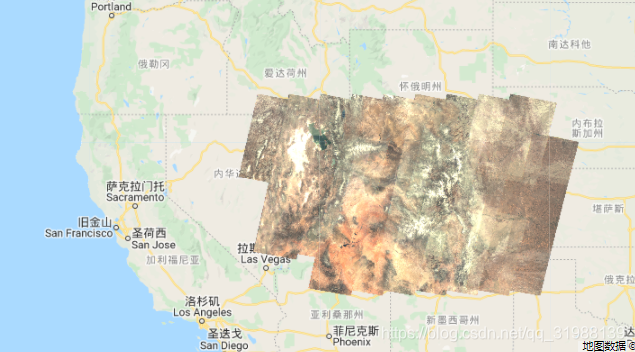
这张是.median()效果
根据自己的需要进行相应分析。