前言
数据不平衡问题在机器学习分类问题中很常见,尤其是涉及到“异常检测"类型的分类。因为异常一般指的相对不常见的现象,因此发生的机率必然要小很多。因此正常类的样本量会远远高于异常类的样本量,一般高达几个数量级。比如:疾病相关的样本,正常的样本会远高于疾病的样本,即便是当下流行的COVID-19。比如kaggle 竞赛的信用卡交易欺诈(credit card fraud),正常交易与欺诈类交易比例大于10000:1。再比如工业中常见的故障诊断数据,正常运行的时间段会远远高于停机(故障)时间。
开题
首先我们提出一个问题:为什么数据不平衡会对机器模型产生影响?原因很直观,因为训练集中的数据如果不平衡,“机器” 会集中解决大多数的数据的问题,而会忽视了少数类的数据。就像少数民族会不占优势。既然是基于大样本训练的机器模型,无法避免地被主要样本带偏。
关键问题来了:那我们如何让少数类获得同等的地位,然后被模型同等对待呢?今天我们可以通过一个实战样本来看看有哪些技巧能降低数据不平衡带来的影响。
数据源准备
数据源是NSL-KDD 数据包。数据源来自:https://www.unb.ca/cic/datasets/nsl.html。简单介绍一下数据源,NSL-KDD是为解决在中KDD'99数据集的某些固有问题而推荐的数据集。尽管该数据集可能无法完美地代表现有的现实网络世界,但是很多论文依然可以用它作有效的基准数据集,以帮助研究人员比较不同的入侵检测方法。
本文数据集来源于github的整理半成品。https://github.com/arjbah/nsl-kdd.git (include the most attack types) 和https://github.com/defcom17/NSL_KDD.git。数据集比较分散,train_file 和test_file 只包含样本特征和标签值,但是没有表头(header),表头的信息包含在field_name_file 中,另外关于网络攻击类型,分为5个大类,40多个小类,但是我们该测试中只预测5个大类。数据源略点凌乱,所以我们需要在代码中稍作归类。代码入场:
# import packages
import pandas as pd
"""
DATASET SOURCE is from https://github.com/arjbah/nsl-kdd.git (include the most attack types)
https://github.com/defcom17/NSL_KDD.git
"""
train_file = 'https://raw.githubusercontent.com/arjbah/nsl-kdd/master/nsl-kdd/KDDTrain%2B.txt'
test_file = 'https://raw.githubusercontent.com/arjbah/nsl-kdd/master/nsl-kdd/KDDTest%2B.txt'
field_name_file = 'https://raw.githubusercontent.com/defcom17/NSL_KDD/master/Field%20Names.csv'
attack_type_file = 'https://raw.githubusercontent.com/arjbah/nsl-kdd/master/training_attack_types.txt'
这里就是常规的pandas 读csv 或txt 操作,仅仅注意一下列表头/列名称的处理。
field_names_df = pd.read_csv(
    field_name_file, header=None, names=[
        'name', 'data_type']) # 定义dataframe ,并给个column name,方便索引
    field_names = field_names_df['name'].tolist()
field_names += ['label', 'label_code'] # 源文件中没有标签名称,以及等级信息
df = pd.read_csv(train_file, header=None, names=field_names)
df_test = pd.read_csv(test_file, header=None, names=field_names)
attack_type_df = pd.read_csv(
    attack_type_file, sep=' ', header=None, names=[
        'name', 'attack_type'])
attack_type_dict = dict(
    zip(attack_type_df['name'].tolist(), attack_type_df['attack_type'].tolist())) # 定义5大类和小类的映射字典,方便替代
df.drop('label_code', axis=1, inplace=True) # 最后一列 既无法作为feature,也不是我们的label,删掉
df_test.drop('label_code', axis=1, inplace=True)
df['label'].replace(attack_type_dict, inplace=True) # 替换label 为5 大类
df_test['label'].replace(attack_type_dict, inplace=True)
数据一览(不平衡分布)
数据已经准备好,我们可以初步浏览一下数据结构。
print(df.info())
结果如下:
Data columns (total 42 columns):
 #   Column                       Non-Null Count   Dtype
---  ------                       --------------   -----
 0   duration                     125973 non-null  int64
 1   protocol_type                125973 non-null  object
 2   service                      125973 non-null  object
 3   flag                         125973 non-null  object
 4   src_bytes                    125973 non-null  int64
 5   dst_bytes                    125973 non-null  int64
 6   land                         125973 non-null  int64
 7   wrong_fragment               125973 non-null  int64
 8   urgent                       125973 non-null  int64
 9   hot                          125973 non-null  int64
 10  num_failed_logins            125973 non-null  int64
 11  logged_in                    125973 non-null  int64
 12  num_compromised              125973 non-null  int64
 13  root_shell                   125973 non-null  int64
 14  su_attempted                 125973 non-null  int64
 15  num_root                     125973 non-null  int64
 16  num_file_creations           125973 non-null  int64
 17  num_shells                   125973 non-null  int64
 18  num_access_files             125973 non-null  int64
 19  num_outbound_cmds            125973 non-null  int64
 20  is_host_login                125973 non-null  int64
 21  is_guest_login               125973 non-null  int64
 22  count                        125973 non-null  int64
 23  srv_count                    125973 non-null  int64
 24  serror_rate                  125973 non-null  float64
 25  srv_serror_rate              125973 non-null  float64
 26  rerror_rate                  125973 non-null  float64
 27  srv_rerror_rate              125973 non-null  float64
 28  same_srv_rate                125973 non-null  float64
 29  diff_srv_rate                125973 non-null  float64
 30  srv_diff_host_rate           125973 non-null  float64
 31  dst_host_count               125973 non-null  int64
 32  dst_host_srv_count           125973 non-null  int64
 33  dst_host_same_srv_rate       125973 non-null  float64
 34  dst_host_diff_srv_rate       125973 non-null  float64
 35  dst_host_same_src_port_rate  125973 non-null  float64
 36  dst_host_srv_diff_host_rate  125973 non-null  float64
 37  dst_host_serror_rate         125973 non-null  float64
 38  dst_host_srv_serror_rate     125973 non-null  float64
 39  dst_host_rerror_rate         125973 non-null  float64
 40  dst_host_srv_rerror_rate     125973 non-null  float64
 41  label                        125973 non-null  object
dtypes: float64(15), int64(23), object(4)
首先我们来看label的分布:
from collections import Counter
# 简单定义一个print 函数
def print_label_dist(label_col):
    c = Counter(label_col)
    print(f'label is {c}')
print_label_dist(df['label'])
print_label_dist(df_test['label'])
可以看到分布为:
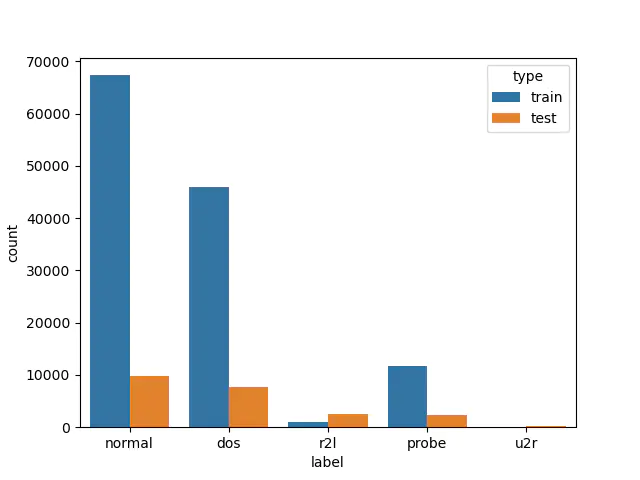
label is Counter({'normal': 67343, 'dos': 45927, 'probe': 11656, 'r2l': 995, 'u2r': 52})
label is Counter({'normal': 9711, 'dos': 7636, 'r2l': 2574, 'probe': 2423, 'u2r': 200})
为了更直观的对比,我们可以看一下countplot 的结果。
import seaborn as sns
train_label= df[['label']]
train_label['type'] = 'train'
test_label= df_test[['label']]
test_label['type'] = 'test'
label_all = pd.concat([train_label,test_label],axis=0)
print(label_all)
print(test_label)
sns.countplot(x='label',hue='type', data=label_all)
这是典型的不平衡数据,正常的样本量远大于其他类别的样本量,尤其是u2r样本类别。
“硬train一”发作为baseline
okay,首先我们来“硬train一发”。最后一列为标签,也就是我们要分类的对象,会被分离出特征矩阵。
Y = df['label']
    Y_test = df_test['label']
    X = df.drop('label', axis=1)
    X_test = df_test.drop('label', axis=1)
对于决策树类型的机器学习模型,单个特征的单调变化不会对最终结果产生影响,因为我们无需log或者归一化处理。
本文我们不进行过多的特征工程,因为我们此次实验中不会对特征进行EDA分析。我们只进行最基本的预处理,有三个feature为object 类型,也就是离散数据,这个需要我们预处理,我们会采用one-hot 进行处理。为了方便,我们写两个小函数,方便重复调用。
# 分离离散变量
def split_category(data, columns):
    cat_data = data[columns]
    rest_data = data.drop(columns, axis=1)
    return rest_data, cat_data
#  转所有离散变量为one-hot
def one_hot_cat(data):
    if isinstance(data, pd.Series):
        data = pd.DataFrame(data, columns=[data.name])
    out = pd.DataFrame([])
    for col in data.columns:
        one_hot_cols = pd.get_dummies(data[col], prefix=col)
        out = pd.concat([out, one_hot_cols], axis=1)
    out.set_index(data.index)
    return out
# categorical_columns
categorical_mask = (X.dtypes == object)
categorical_columns = X.columns[categorical_mask].tolist()
X, X_cat = split_category(X, categorical_columns)
X_test, X_test_cat = split_category(X_test, categorical_columns)
# convert to one-hot
X_cat_one_hot_cols = one_hot_cat(X_cat)
X_test_cat_one_hot_cols = one_hot_cat(X_test_cat)
# align train to test
X_cat_one_hot_cols, X_test_cat_one_hot_cols = X_cat_one_hot_cols.align(
    X_test_cat_one_hot_cols, join='inner', axis=1)
X_cat_one_hot_cols.fillna(0, inplace=True)
X_test_cat_one_hot_cols.fillna(0, inplace=True)
X = pd.concat([X, X_cat_one_hot_cols], axis=1)
X_test = pd.concat([X_test, X_test_cat_one_hot_cols],
                   axis=1)
print(f'add one-hot features')
print(f'x shape is {X.shape}')
x shape is (125973, 116)
准备lightgbm 模型.
import lightgbm as lgb
from sklearn.preprocessing import LabelEncoder
from sklearn.metrics import confusion_matrix,classification_report,accuracy_score,roc_auc_score,f1_score
feature_name = list(X.columns) # 特征名称后续会用到
Y_encode = LabelEncoder().fit_transform(Y)
Y_test_encode = LabelEncoder().fit_transform(Y_test)
dtrain = lgb.Dataset(X.values, label=Y_encode)
dtest = lgb.Dataset(X_test.values, label=Y_test_encode)
param = {
    'eta': 0.1,
    'objective': 'multiclass',
    'num_class': 5,
    'verbose': 0,
        'metric':'multi_error'
} # 参数几乎都是默认值,仅仅修改一些多分类必须的参数
evals_result = {}
valid_sets = [dtrain, dtest]
valid_name = ['train', 'eval']
model = lgb.train(param, dtrain, num_boost_round=500, feature_name=feature_name,
                  valid_sets=valid_sets, valid_names=valid_name, evals_result=evals_result)
y_pred_1 = model.predict(X_test.values)
y_pred = pd.DataFrame(y_pred_1).idxmax(axis=1) #预测概率值转为预测标签
#
# 我们用了多种metric 来衡量结果,其中有些是明显不适合的,比如accuracy,因为它会被不平衡的数据分布带到阴沟里(误导)。
print(f'auc score is {accuracy_score(Y_test_encode, y_pred)}')
print(confusion_matrix(Y_test_encode, y_pred))
print(classification_report(Y_test_encode, y_pred, digits=3))
auc = roc_auc_score(Y_test_encode, y_pred_1, multi_class="ovo", average="macro") # 选用macro 很重要。参考sklearn。
#Calculate metrics for each label, and find their unweighted mean. #This does not take label imbalance into account.
print(f'roc_auc_score  is {auc}')
f1 = f1_score(y_pred, Y_test_encode, average='macro')
print(f'f1_score  is {f1}')
硬train的结果如下:acc 指标已经提到,会有误导性,这里列出就是为了参考。report中3 和4 precision 和recall 较低,这也很正常,因为数据不平衡嘛。
acc score is 0.6652767920511
  precision    recall  f1-score   support
0      0.840     0.645     0.730      7636
1      0.619     0.899     0.734      9711
2      0.570     0.547     0.558      2423
3      0.312     0.002     0.004      2574
4      0.026     0.030     0.028       200
accuracy                          0.665     22544
macro avg      0.473     0.425     0.411     22544
roc_auc_score  is 0.6405673646606284
f1_score  is 0.41066470104083724
我们稍作改善
改进的方向,我认为会有一下几个方面:
- 采用更多的数据集,很显然臣妾做不到
- 换其他的模型,比如异常诊断(半监督或者无监督),不在我们讨论范围
- 小心谨慎的特征工程,需要一定的先验知识
- 调参。
- 重采样
- 其他
我们在此也硬“tune”一发,看当前的模型是否可以调整参数,进行一定程度改善。至于特征工程,如果是作为一个项目,还是可以深究,本文不涉及。
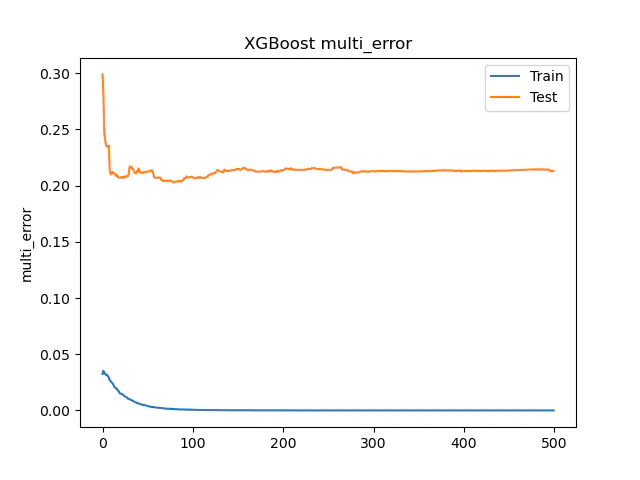
我们分析一下模型训练的历史曲线。
曲线惨不忍睹,但是还是可以看到train 和test 最后都已经趋近水平,也就是num_boost_round 参数已经让目前的模型找到较理想的值了。
重采样
我们对模型加上重采样,重采样的思路很简单,就是重新采样让不同类别的样本量趋于平等。升采样和降采样,也是最常用的方法。对于本案例的数据,如果我们采用降采样,会损失太多的信息。而且可控(样本量)的降采样,一般也就是随机降采样,对于随机的结果无法有太多的说服力。不可控的降采样,最终会导致样本量接近于最小类别的样本量,也就是本案例中的20多。这样会大大丢失样本信息。
因此本文中采用升采样的方法,常见的升采样有多种。我们采用的imbalanced-learn (https://imbalanced-learn.readthedocs.io/en/stable/ )的包,里面包含多种升采样方法,网上似乎一提 升采样,就是SMOTE。本文中采用的ADASYN(对本案例来说,效果更好,各位可以自行对比)。
# 代码需要放置在one-hot 之前
from imblearn.over_sampling import SMOTE, ADASYN
from sklearn.preprocessing import LabelEncoder
def label_encoder(data):
    labelencoder = LabelEncoder()
    for col in data.columns:
        data.loc[:,col] = labelencoder.fit_transform(data[col])
    return data
# first label_encoder to allow resampling
X[categorical_columns] = label_encoder(X[categorical_columns])
X_test[categorical_columns] = label_encoder(X_test[categorical_columns])
oversample = ADASYN()
X, Y = oversample.fit_resample(X, Y)
# 之后的代码为
#X, X_cat = split_category(X, categorical_columns)
#X_test, X_test_cat = split_category(X_test, categorical_columns)
先不进行lightbgm调参,我们看一下结果:
acc score is 0.7869943222143364
[[6258 1126  251    1    0]
 [  61 9364  276    6    4]
 [ 164  403 1856    0    0]
 [   0 2299   21  246    8]
 [   0  152   22    8   18]]
              precision    recall  f1-score   support
           0      0.965     0.820     0.886      7636
           1      0.702     0.964     0.812      9711
           2      0.765     0.766     0.766      2423
           3      0.943     0.096     0.174      2574
           4      0.600     0.090     0.157       200
    accuracy                          0.787     22544
   macro avg      0.795     0.547     0.559     22544
weighted avg      0.824     0.787     0.754     22544
roc_auc_score  is 0.9097110919608917
f1_score  is 0.5588737585068755
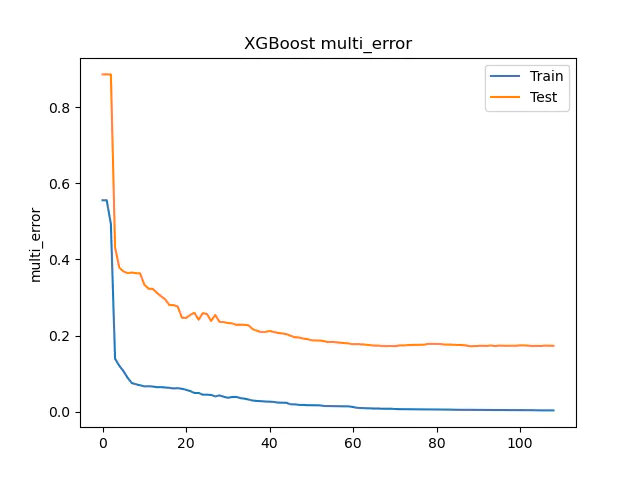
各项指标都有提升,同样的回顾一下我们的训练曲线。尾巴依然光滑,说明不算欠拟合。train 和test 的间距有些大,可能有过拟合之嫌。
我们试试是否为过拟合,对于数模型,最好控制的就是tree max depth,一般推荐为3-10,我们采用的默认6. 我们可以将为3 试试。
acc score is 0.7916962384669979
[[6277 1163  196    0    0]
 [  90 9319  248   25   29]
 [ 166  356 1901    0    0]
 [   4 2174   45  329   22]
 [   0  104   54   20   22]]
              precision    recall  f1-score   support
           0      0.960     0.822     0.886      7636
           1      0.711     0.960     0.816      9711
           2      0.778     0.785     0.781      2423
           3      0.880     0.128     0.223      2574
           4      0.301     0.110     0.161       200
    accuracy                          0.792     22544
   macro avg      0.726     0.561     0.574     22544
weighted avg      0.818     0.792     0.763     22544
roc_auc_score  is 0.8931058881203062
f1_score  is 0.5735623327532393
结果略有变化,好像更侧重于f1_score的分数。
偏向少数类
对于不平衡的数据,如果有需要,我们还可以通过分配权重,来让模型偏向少数类。通过这样的方法,我们又可以一定程度的平衡模型。lightgbm 支持样本权重,我们可以调整权重来重新训练。上代码:
class_w = {
    'normal': 0.1,  # 0.1
    'dos': 0.6,
    'probe': 0.6,
    'r2l': 2,
    'u2r': 1.2} #以上数据需要微调,调整一般从normal开始,因为它的权重大
from sklearn.utils.class_weight import compute_sample_weight
sample_w = compute_sample_weight(class_weight=class_w, y=Y)
##!!然后传入该权重到数据集中
dtrain = lgb.Dataset(X.values, label=Y_encode,weight=sample_w)
训练结果与效果:
acc score is 0.828069552874379
[[6448  684  366   63   75]
 [ 142 8551  271  434  313]
 [ 203    3 2185   12   20]
 [  10  895   28 1442  199]
 [   0    5  109   44   42]]
              precision    recall  f1-score   support
           0      0.948     0.844     0.893      7636
           1      0.843     0.881     0.862      9711
           2      0.738     0.902     0.812      2423
           3      0.723     0.560     0.631      2574
           4      0.065     0.210     0.099       200
    accuracy                          0.828     22544
   macro avg      0.663     0.679     0.659     22544
weighted avg      0.847     0.828     0.834     22544
roc_auc_score  is 0.8996899325820623
f1_score  is 0.6593715668480359
可以看到f1-score 有了很大的提升,当然你可以继续调整该class_w 去让你的模型有所侧重。multi_error 也降低了。
总结
对于不平衡的数据集,重新采样和调整权重会对结果产生影响。当然其他的超参可以gridsearch 来优化,本文不做研究。 来深入了解不同采样的影响。
后记
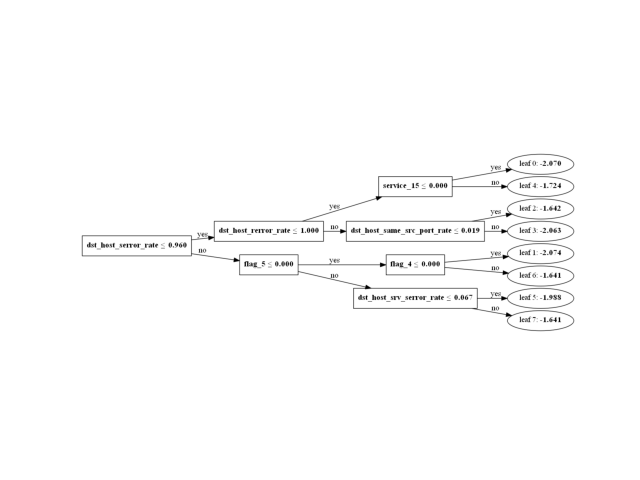
附上windows 中lightgbm 树图的plot以及特征重要性的plot代码。
import os
graphviz_path = r'C:\Program Files (x86)\Graphviz2.38\bin'
os.environ["PATH"] += os.pathsep + graphviz_path
lgb.plot_tree(model, tree_index=0)
lgb.plot_importance(model)


