多元线性回归
预测房子的售价。这次的不同之处在于我们有多个因变量。我们知道房子的大小,以及房子里卧室的数量。我们尝试扩展以前的代码来处理多元线性回归
版权声明:本文内容由阿里云实名注册用户自发贡献,版权归原作者所有,阿里云开发者社区不拥有其著作权,亦不承担相应法律责任。具体规则请查看《阿里云开发者社区用户服务协议》和《阿里云开发者社区知识产权保护指引》。如果您发现本社区中有涉嫌抄袭的内容,填写侵权投诉表单进行举报,一经查实,本社区将立刻删除涉嫌侵权内容。
首先让我们看一下数据
path = os.getcwd() + '\data\ex1data2.txt'
data2 = pd.read_csv(path, header=None, names=['Size', 'Bedrooms', 'Price'])
data2.head()
    Size         Bedrooms     Price
0	2104	     3	          399900
1	1600	     3	          329900
2	2400	     3	          369000
3	1416	     2	          232000
4	3000	     4	          539900
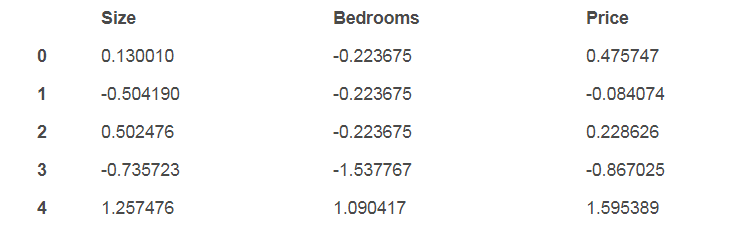
每个变量值的大小都是不同的,一个房子大约有2-5个卧室,可能每个房间的大小都不一样,如果我们在这个数据集上运行原来的回归算法,那么“size”影响的权重就太大了,就会降低“number of bedrooms”的影响,为了解决这个问题,我们需要做一些所谓的“特征标准化”。也就是需要调整特征的比例来平衡竞争关系。一种方法是用特征的均值减去另一个特征的均值,然后除以标准差。这是使用的pandas的代码。
data2= (data2- data2.mean())/ data2.std()
data2.head()

接下来我们需要修改练习一中的线性回归的实现,以处理多个因变量。下面是梯度下降函数的代码。
def gradientDescent(X, y, theta, alpha, iters):
    temp = np.matrix(np.zeros(theta.shape))
    parameters = int(theta.ravel().shape[1])
    cost = np.zeros(iters)

    for i in range(iters):
        error = (X * theta.T) - y

        for j in range(parameters):
            term = np.multiply(error, X[:,j])
            temp[0,j] = theta[0,j] - ((alpha / len(X)) * np.sum(term))

        theta = temp
        cost[i] = computeCost(X, y, theta)

    return theta, cost
仔细观察计算误差项的代码行error = (X * theta.T) – y,我们会在矩阵运算中一直使用它。这是线性代数在工作中的力量:不管X中有多少变量(列),只要参数的个数是一致的,这个代码就能正常工作。类似地,只要y中的行数允许,它将计算X中每行的错误项。这是一种将ANY表达式一次性应用于大量实例的有效方法。
由于我们的梯度下降和成本函数都使用矩阵运算,所以处理多元线性回归所需的代码实际上没有变化。我们来测试一下,首先通过初始化创建适当的矩阵来传递函数。
# add ones column
data2.insert(0, 'Ones', 1)

# set X (training data) and y (target variable)
cols = data2.shape[1]
X2 = data2.iloc[:,0:cols-1]
y2 = data2.iloc[:,cols-1:cols]

# convert to matrices and initialize theta
X2 = np.matrix(X2.values)
y2 = np.matrix(y2.values)
theta2 = np.matrix(np.array([0,0,0]))
现在运行,看会发生什么
# perform linear regression on the data set
g2, cost2 = gradientDescent(X2, y2, theta2, alpha, iters)

# get the cost (error) of the model
computeCost(X2, y2, g2)
0.13070336960771897
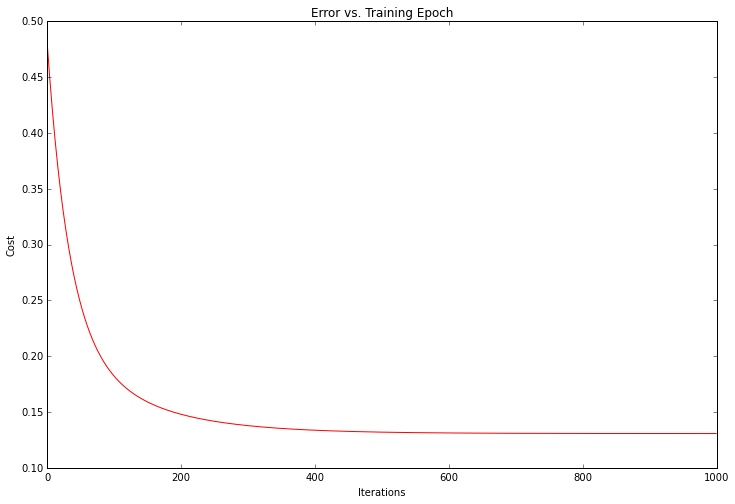
我们可以绘制训练过程,确认实际误差随着每次迭代梯度下降而减少。
fig, ax = plt.subplots(figsize=(12,8))
ax.plot(np.arange(iters), cost2, 'r')
ax.set_xlabel('Iterations')
ax.set_ylabel('Cost')
ax.set_title('Error vs. Training Epoch')

解决方案的成本或误差随着每个成功的迭代而下降,直到它触底。这正是我们希望发生的事情。我们的算法起作用了。
Python的伟大之处在于它的庞大的开发者社区和丰富的开源软件。在机器学习领域,顶级Python库是scikit-learn。让我们看看如何使用scikit- learn的线性回归类来处理第一部分的简单线性回归任务。
from sklearn import linear_model
model = linear_model.LinearRegression()
model.fit(X, y)
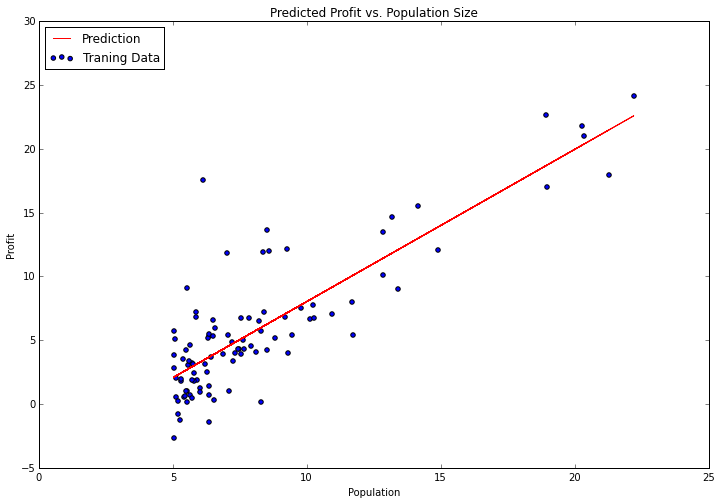
没有比这更简单的了。“fit”方法有很多参数,我们可以根据我们想要的算法来调整参数,默认值可以感测到遗留下来的问题。试着绘制拟合参数,和之前的结果比较。
x = np.array(X[:, 1].A1)
f = model.predict(X).flatten()

fig, ax = plt.subplots(figsize=(12,8))
ax.plot(x, f, 'r', label='Prediction')
ax.scatter(data.Population, data.Profit, label='Traning Data')
ax.legend(loc=2)
ax.set_xlabel('Population')
ax.set_ylabel('Profit')
ax.set_title('Predicted Profit vs. Population Size')

可参考:https://www.johnwittenauer.net/machine-learning-exercises-in-python-part-2/)