在机器上部署 blackbox_exporter
- 项目地址 https://github.com/prometheus/blackbox_exporter
使用ansible部署 blackbox_exporter
ansible-playbook -i host_file service_deploy.yaml -e "tgz=blackbox_exporter-0.18.0.linux-amd64.tar.gz" -e "app=blackbox_exporter"
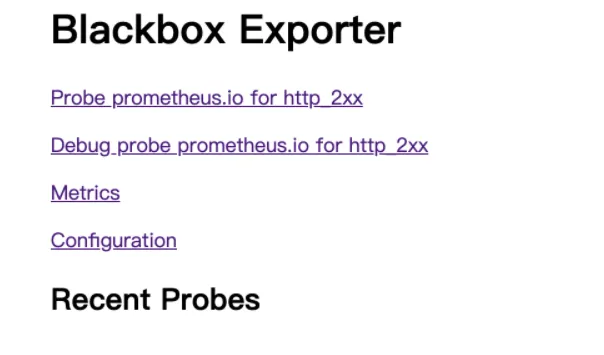
访问页面
http://ip:9115/
http trace中对于http各个状态的描述
- dns解析时间:              DNSDone-DNSStart
- tls握手时间:              gotConn - DNSDone
- tls connect连接时间:      connectDone - DNSDone
- 非tls connect连接时间:    gotConn - DNSDone
- processing 服务端处理时间: responseStart - gotConn
- transfer 数据传输时间:     end - responseStart
trace := &httptrace.ClientTrace{
    DNSStart:             tt.DNSStart,
    DNSDone:              tt.DNSDone,
    ConnectStart:         tt.ConnectStart,
    ConnectDone:          tt.ConnectDone,
    GotConn:              tt.GotConn,
    GotFirstResponseByte: tt.GotFirstResponseByte,
}
blackbox_exporter 需要传入target 和 module 参数,采用下列方式加入的采集池中
  - job_name: 'blackbox-http'
    metrics_path: /probe
    params:
      module: [http_2xx]  # Look for a HTTP 200 response.
    static_configs:
      - targets:
        - http://prometheus.io    # Target to probe with http.
        - https://www.baidu.com   # Target to probe with https.
        - http://172.16.58.78:3000 # Target to probe with http on port 3000.
    relabel_configs:
      - source_labels: [__address__]
        target_label: __param_target
      - source_labels: [__param_target]
        target_label: instance
      - target_label: __address__
        replacement: 172.16.58.78:9115  # The blackbox exporter's real hostname:port.
会发现如此配置之后 实例数据只有blackbox_exporter的地址 而没有target的地址
probe_duration_seconds{instance="172.20.70.205:9115", job="blackbox-http"}
blackbox_exporter 采集加入的采集池中
  - job_name: 'blackbox-ssh'
    metrics_path: /probe
    params:
      module: [ssh_banner]  # Look for a HTTP 200 response.
    static_configs:
      - targets:
        - 172.16.58.78:22   # Target to probe with http.
        - 172.16.58.79:22   # Target to probe with https.
    relabel_configs:
      - source_labels: [__address__]
        target_label: __param_target
      - source_labels: [__param_target]
        target_label: instance
      - target_label: __address__
        replacement: 172.16.58.78:9115  # The blackbox exporter's real hostname:port.
  - job_name: 'blackbox-ping'
    metrics_path: /probe
    params:
      module: [icmp]  # Look for a HTTP 200 response.
    static_configs:
      - targets:
        - 172.16.58.78   # Target to probe with http.
        - 172.16.58.79   # Target to probe with https.
        - 8.8.8.8
    relabel_configs:
      - source_labels: [__address__]
        target_label: __param_target
      - source_labels: [__param_target]
        target_label: instance
      - target_label: __address__
        replacement: 172.16.58.78:9115  # The blackbox exporter's real hostname:port.
grafana 上导入 blackbox_exporter dashboard
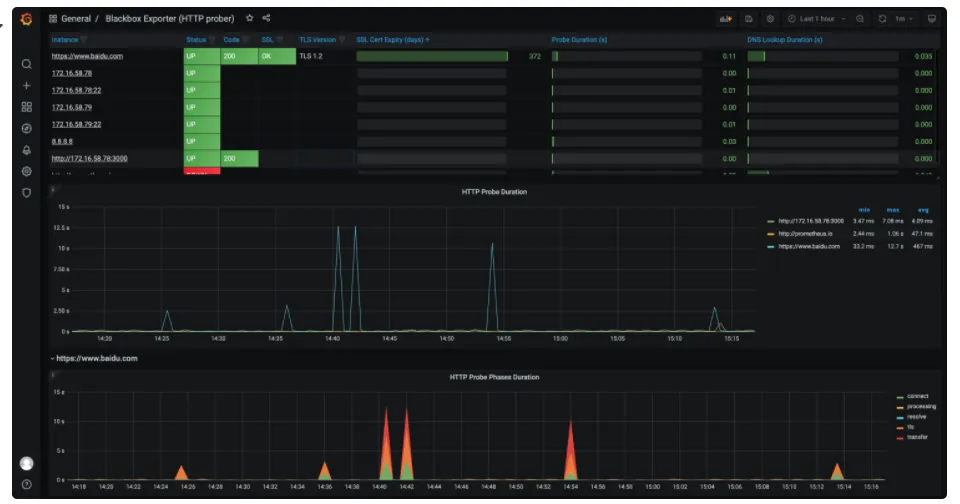
ssh探测 基于tcp
- 页面访问探测
# 模块使用 ssh_banner 探测172.20.70.215:22
http://172.20.70.205:9115/probe?module=ssh_banner&target=172.20.70.215:22
# 结果解读
# HELP probe_dns_lookup_time_seconds Returns the time taken for probe dns lookup in seconds
# TYPE probe_dns_lookup_time_seconds gauge
probe_dns_lookup_time_seconds 2.5331e-05
# HELP probe_duration_seconds Returns how long the probe took to complete in seconds
# TYPE probe_duration_seconds gauge
probe_duration_seconds 0.02228226
# HELP probe_failed_due_to_regex Indicates if probe failed due to regex
# TYPE probe_failed_due_to_regex gauge
probe_failed_due_to_regex 0
# HELP probe_ip_addr_hash Specifies the hash of IP address. It's useful to detect if the IP address changes.
# TYPE probe_ip_addr_hash gauge
probe_ip_addr_hash 9.51584696e+08
# HELP probe_ip_protocol Specifies whether probe ip protocol is IP4 or IP6
# TYPE probe_ip_protocol gauge
probe_ip_protocol 4
# HELP probe_success Displays whether or not the probe was a success
# TYPE probe_success gauge
probe_success 1
# ssh_banner 模块解读
# 使用tcp进行探测,并且 期望得到 SSH-2.0-的响应
  ssh_banner:
    prober: tcp
    tcp:
      query_response:
      - expect: "^SSH-2.0-"
# 和telnet结果一致
[root@prome_master_01 blackbox_exporter]# telnet 172.20.70.215 22
Trying 172.20.70.215...
Connected to 172.20.70.215.
Escape character is '^]'.
SSH-2.0-OpenSSH_7.4
Protocol mismatch.
Connection closed by foreign host.
  - job_name: 'blackbox-ssh'
    metrics_path: /probe
    params:
      module: [ssh_banner]  # Look for a HTTP 200 response.
    static_configs:
      - targets:
        - 172.16.58.78:22   # Target to probe with http.
        - 172.16.58.79:22   # Target to probe with https.
    relabel_configs:
      - source_labels: [__address__]
        target_label: __param_target
      - source_labels: [__param_target]
        target_label: instance
      - target_label: __address__
        replacement: 172.16.58.78:9115  # The blackbox exporter's real hostname:port.
进行ping探测
http://172.20.70.205:9115/probe?module=icmp&target=www.baidu.com
# 结果解读
# HELP probe_dns_lookup_time_seconds Returns the time taken for probe dns lookup in seconds
# TYPE probe_dns_lookup_time_seconds gauge
probe_dns_lookup_time_seconds 0.195704171
# HELP probe_duration_seconds Returns how long the probe took to complete in seconds
# TYPE probe_duration_seconds gauge
probe_duration_seconds 0.378563375
# HELP probe_icmp_duration_seconds Duration of icmp request by phase
# TYPE probe_icmp_duration_seconds gauge
probe_icmp_duration_seconds{phase="resolve"} 0.195704171
probe_icmp_duration_seconds{phase="rtt"} 0.182456226
probe_icmp_duration_seconds{phase="setup"} 0.000145827
# HELP probe_icmp_reply_hop_limit Replied packet hop limit (TTL for ipv4)
# TYPE probe_icmp_reply_hop_limit gauge
probe_icmp_reply_hop_limit 49
# HELP probe_ip_addr_hash Specifies the hash of IP address. It's useful to detect if the IP address changes.
# TYPE probe_ip_addr_hash gauge
probe_ip_addr_hash 2.282787449e+09
# HELP probe_ip_protocol Specifies whether probe ip protocol is IP4 or IP6
# TYPE probe_ip_protocol gauge
probe_ip_protocol 4
# HELP probe_success Displays whether or not the probe was a success
# TYPE probe_success gauge
probe_success 1
- job_name: 'blackbox-ping'
    metrics_path: /probe
    params:
      module: [icmp]  # Look for a HTTP 200 response.
    static_configs:
      - targets:
        - 172.16.58.78   # Target to probe with http.
        - 172.16.58.79   # Target to probe with https.
        - 8.8.8.8
    relabel_configs:
      - source_labels: [__address__]
        target_label: __param_target
      - source_labels: [__param_target]
        target_label: instance
      - target_label: __address__
        replacement: 172.16.58.78:9115  # The blackbox exporter's real hostname:port.
ssh探测过程说明
prometheus --> blackbox_exporter 使用配置 http://192.168.0.112:9115/probe?module=ssh_banner&target=192.168.0.127%3A22  --> 192.168.0.127:22