draw graph using gnuplot

简介: draw graph using gnuplot

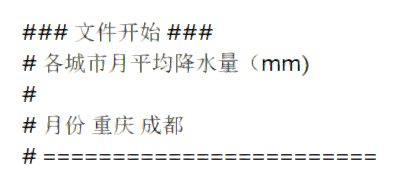
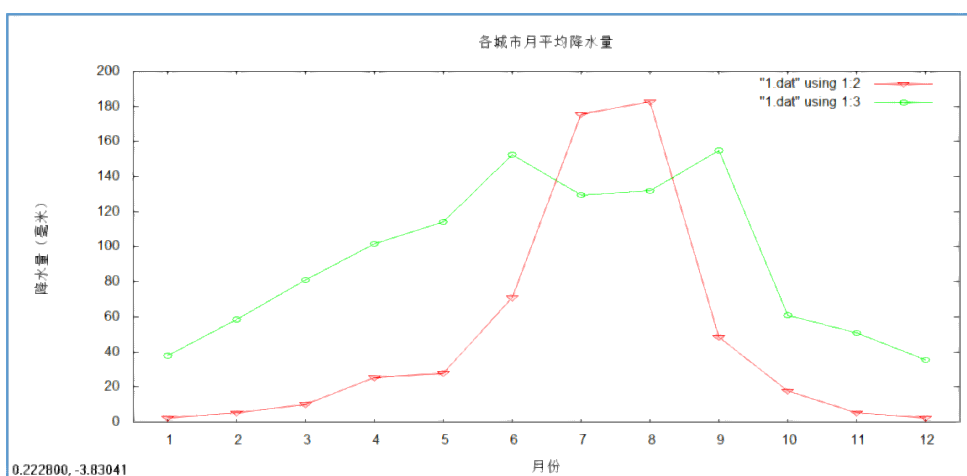
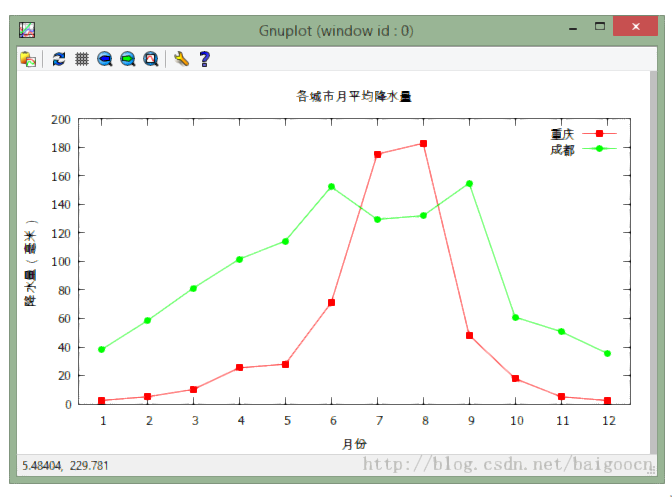
image.png1 2.5 38.1 2 5.1 58.4 3 10.2 81.3 4 25.4 101.6 5 27.9 114.3 6 71.1 152.4 7 175.3 129.5 8 182.9 132.1 9 48.3 154.9 10 17.8 61.0 11 5.1 50.8 12 2.5 35.6 ### 文件结束 ### set xlabel "月份" set ylabel "降水量(毫米)" set title "各城市月平均降水量" set xrange [0.5:12.5] set xtics 1,1,12 plot "1.dat" u 1:2 w lp pt 5 title "重庆","1.dat" u 1:3 w lp pt 7 title "成都" plot "1.dat" using 1:2 w lp pt 5, "1.dat" using 1:3 w lp pt 7  


image.png这里使用了一个新的命令:using。在数据文件包含超过一组数据时,我们可以用using指定使用哪列数据。例如using 1:2表示使用第一列和第二列数据,第一列为横轴,第二列为纵轴。以此类推,using 1:3表示使用第一列和第三列数据。如果把多组数据绘制到一个图上,只要使用一个plot命令,后面跟多组数据,每组数据之间用逗号隔开就可以了。 显然,这里的图例又把图像搞乱了。我们没有像以前那样把图例去掉,因为这里有两组数据,我们需要保留图例。怎么办呢?我们来使用下面的命令: plot "jiangshui.dat" u 1:2 w lp pt 5 title "重庆","jiangshui.dat" u 1:3 w lp pt 7 title "成都"  image.png注意到了吗?这里我们使用了字母 u 作为 using 的缩写。另外,这里用了新的参数 title。这里的 title 和之前我们用过的 set title 不同。set title 指定的是整个图的标题,而这里的 title 跟在每一组数据参数后面,指定的是每组数据对应的图例中的 title。这样,我们的图看起来整洁多了。
相关文章
|
6月前
135Echarts - 路径图(Use lines to draw 1 million ny streets.)
16 0
|
6月前
200Echarts - 自定义系列(Use custom series to draw wind vectors)
15 0
用turtle库绘制图形(forest)
85 0
用turtle库绘制图形(forest)
|
数据可视化
使用ComplexHeatmap绘制复杂热图|Note1:简介
复杂的热图可以有效地可视化不同数据源之间的关联,并揭示潜在的模式。ComplexHeatmap包提供了一种高度灵活的方式来安排多个热图,并支持自定义的注释图形。
253 0
|
机器学习/深度学习
Leetcode-Easy 887. Projection Area of 3D Shapes
107 0
Leetcode-Easy 887. Projection Area of 3D Shapes
|
算法
Split Shape by Plane in OpenCASCADE
Split Shape by Plane in OpenCASCADE eryar@163.com Abstract. Sometimes you want to split a shape by plane or even split a shape by a B Spline surfac...
1652 0
|
人工智能 图形学
OpenCASCADE Shape Location
OpenCASCADE Shape Location eryar@163.com Abstract. The TopLoc package of OpenCASCADE gives resources to handle 3D local coordinate systems called Locations.
1521 0
Make Helix Shape in occQt
Make Helix Shape in occQtPCurve is a powerful modeling method, to make helix shapes in occQt to help you understand pcurve better, then you can also can model some intereting shape based on pcurve.
950 0
|
开发工具 git
graphviz dot初探
graphviz dot初探 简介 现在文档都用markdown保存到github、gitlab这种代码仓库。markdown遇到最大的问题就是对图片的引用, 直接用工具绘制的图片可以引用,但是这样没法像md文件那样在git仓库中进行版本管理,而且既然文档用了描述语言, 引用图片源文件能用描
3419 0