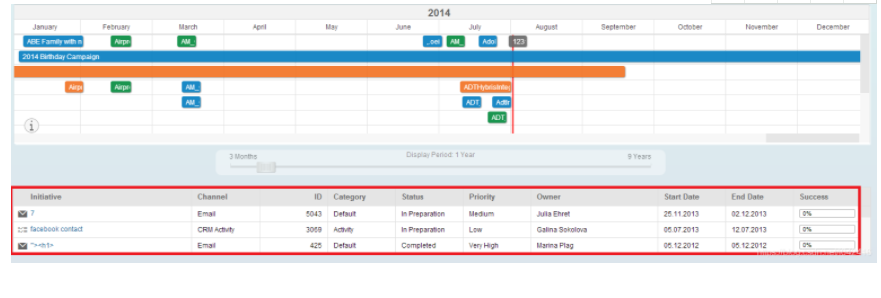
Suppose I need to investigate how the entities of Initiatives displayed in the table control below is accessed via OData in UI5 application Customer Engagement Initiative (CEI):
Requirement1: find out the OData Access URL for Initiatives in table control.
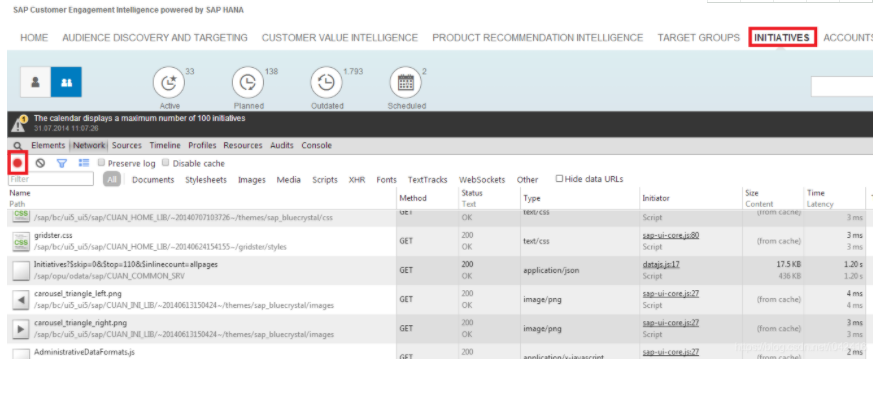
Launch the CEI application via Chrome, click F12 to open development tool, go to tab Network, switch on Record mode by clicking button “Record Network Log”.
Then click the INITIATIVES work center and display the table control as usual. The record icon turns red which indicates currently the network traffic is recorded. You should observe lots of traffic logged as below.
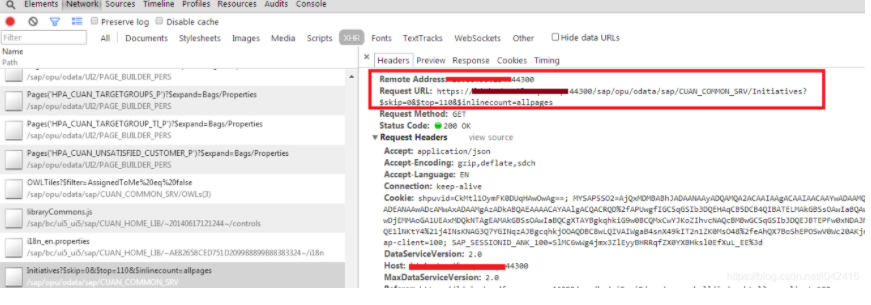
Click filter button, and filter by “XHR” ( Xml Http Request), then check starting from the bottom-most, and soon you find the OData access url for initiatives:
So this url “https://:44300/sap/opu/odata/sap/CUAN_COMMON_SRV/Initiatives?KaTeX parse error: Expected 'EOF', got '&' at position 7: skip=0&̲top=110&$inlinecount=allpages” is just what we are looking for. Write it down for later usage.
Click Preview tab, and you can check the initiative instance contained in Odata response, to compare each field with UI ( for example, ID, Creator, CreatedOnDate, EndDate etc ).
The CreatedOn and EndDate store the Unix time-stamp since 1970, you can easily convert it via the link below, the converted time is now exactly the same as what you see in UI.
http://www.unixtimestamp.com/index.php
Requirement2: find out which application view has consumed this OData url to access Initiatives data from ABAP backend
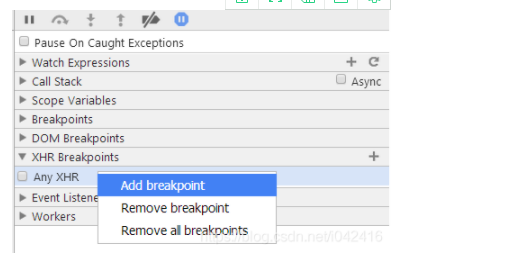
Go to Chrome development tool, expand tab “XHR Breakpoints”, choose “Add breakpoint” from context menu, and type the url part we find in step1: /sap/opu/odata/sap/CUAN_COMMON_SRV/Initiatives?KaTeX parse error: Expected 'EOF', got '&' at position 7: skip=0&̲top=110&$inlinecount=allpages.
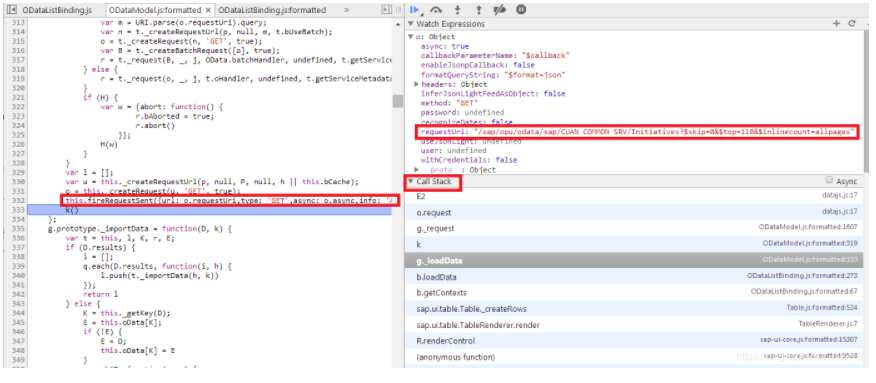
And click Initiative work center, then the breakpoint is triggered. Type “o” in Watch Expressions and we can observe the OData access request is set via line 332 below with the very url we find in step1.
Now we need to find out which view has consumed this OData service. Expand tab “Call Stack”:
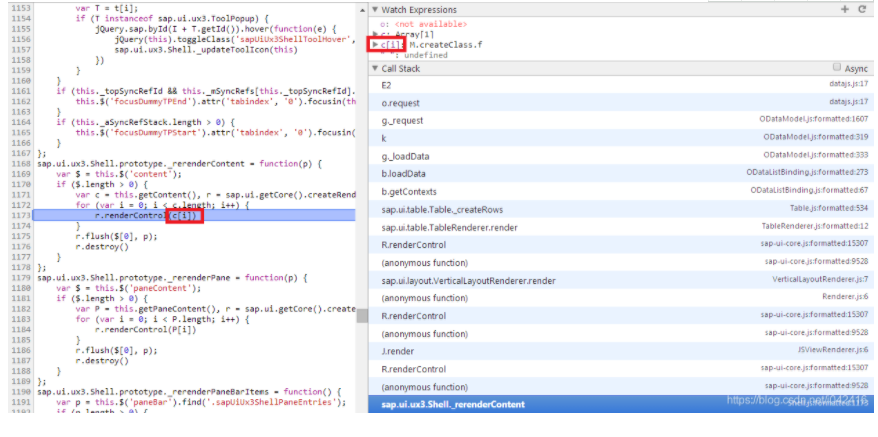
From the call-stack it is very clear the table which displays the initiative data is being rendered. We focus on call-stack highlighted below, the variable c[i] contains the information of table view. Type “c[i]” in Watch Expressions tab and expand it:
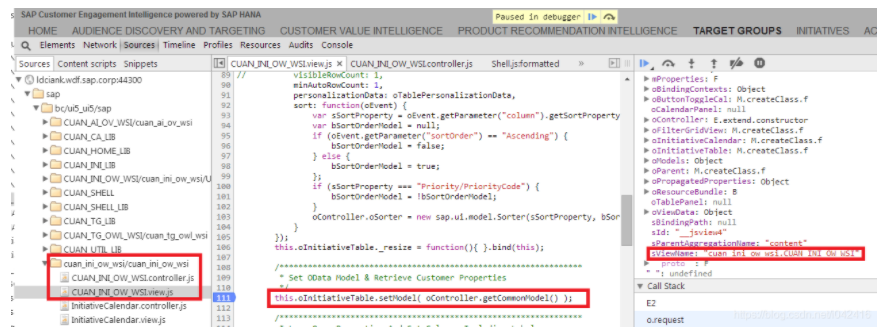
Here we could find view name and thus could identify the application view in the right hierarchy, and then find how the OData model is bound to the table control in CUAN_INI_OW_WSI.view.js and how the OData model is initialized in controller CUAN_INI_OW_WSI.controller.js.
