建议软件包安装,二进制安装请自行解决配置问题,docker 安装需考虑网络问题。
linux 软件包直接部署
apt install prometheus-blackbox-exporter二进制部署
# 下载安装
wget https://github.com/prometheus/blackbox_exporter/releases/download/v0.23.0/blackbox_exporter-0.23.0.linux-amd64.tar.gz
tar -xvf  blackbox_exporter-0.23.0.linux-amd64.tar.gz
mv blackbox_exporter-0.23.0.linux-amd64/ /usr/local/blackbox_exporter

# 创建配置文件
cat > /data/black_exporter/black_exporter.yml << EOF
modules:
  http_2xx:
    prober: http
    timeout: 20s
    http:
      preferred_ip_protocol: "ip4"
  http_post_2xx_query:
    prober: http
    timeout: 20s
    http:
      preferred_ip_protocol: "ip4" ##使用ipv4
      method: POST
      headers:
        Content-Type: application/json ##header头
      body: '{"hmac":"","params":{"publicFundsKeyWords":"xxx"}}' ##传参
  tls_connect_tls:
    prober: tcp
    timeout: 5s
    tcp:
      tls: true
  tcp_connect:
    prober: tcp
    timeout: 5s
 #
  pop3s_banner:
    prober: tcp
    tcp:
      query_response:
      - expect: "^+OK"
      tls: true
      tls_config:
        insecure_skip_verify: false
  ssh_banner:
    prober: tcp
    tcp:
      query_response:
      - expect: "^SSH-2.0-"
  irc_banner:
    prober: tcp
    tcp:
      query_response:
      - send: "NICK prober"
      - send: "USER prober prober prober :prober"
      - expect: "PING :([^ ]+)"
        send: "PONG ${1}"
      - expect: "^:[^ ]+ 001"
  icmp:
    prober: icmp
    timeout: 20s
EOF

# 配置systemd
cat > /etc/systemd/system/blackbox_exporter.service <<EOF
[Unit]
Description=blackbox_exporter
Documentation=https://prometheus.io/
After=network.target

[Service]
Type=simple
User=prometheus
ExecStart=/usr/local/bin/blackbox_exporter  --config.file=/data/blackbox-exporter/black-exporter.yml
Restart=on-failure

[Install]
WantedBy=multi-user.target
EOF

# 启动服务
systemctl enable blackbox_exporter.service
systemctl start blackbox_exporter.service
systemctl status blackbox_exporter.service
Docker 部署
docker run --rm \
  -p 9115/tcp \
  --name blackbox_exporter \
  -v $(pwd):/config \
  quay.io/prometheus/blackbox-exporter:latest --config.file=/config/blackbox.yml


# 创建配置文件
cat > /data/docker/blackbox-exporter/black-exporter.yml << EOF
modules:
  http_2xx:
    prober: http
    timeout: 20s
    http:
      preferred_ip_protocol: "ip4"
  http_post_2xx_query:
    prober: http
    timeout: 20s
    http:
      preferred_ip_protocol: "ip4" ##使用ipv4
      method: POST
      headers:
        Content-Type: application/json ##header头
      body: '{"hmac":"","params":{"publicFundsKeyWords":"xxx"}}' ##传参
  tls_connect_tls:
    prober: tcp
    timeout: 5s
    tcp:
      tls: true
  tcp_connect:
    prober: tcp
    timeout: 5s
 #
  pop3s_banner:
    prober: tcp
    tcp:
      query_response:
      - expect: "^+OK"
      tls: true
      tls_config:
        insecure_skip_verify: false
  ssh_banner:
    prober: tcp
    tcp:
      query_response:
      - expect: "^SSH-2.0-"
  irc_banner:
    prober: tcp
    tcp:
      query_response:
      - send: "NICK prober"
      - send: "USER prober prober prober :prober"
      - expect: "PING :([^ ]+)"
        send: "PONG ${1}"
      - expect: "^:[^ ]+ 001"
  icmp:
    prober: icmp
    timeout: 20s
EOF

docker run -d \
  --net myDefault \
  --restart always \
  -p 9115:9115/tcp \
  --name blackbox-exporter \
  -v /data/docker/blackbox-exporter:/config \
  songtianlun/blackbox-exporter:v0.23.0 --config.file=/config/black-exporter.yml
测试使用
curl http://192.168.5.152:9115/probe?target=www.frytea.com&module=http_2xxprometeus 使用
# https monitor
- job_name: 'hci-https-monitor'
metrics_path: /probe
params:
module: [tls_connect_tls]
static_configs:
- targets:
- 'https://192.168.5.221:8006'
- 'https://192.168.5.222:8006'
- 'https://192.168.5.187:8006'
relabel_configs:
- source_labels: [__address__]
target_label: __param_target
- source_labels: [__param_target]
target_label: instance
- target_label: __address__
replacement: 10.19.0.1:9115 # The blackbox exporter's real hostname:port.
# http monitor
- job_name: 'hci-http-monitor'
metrics_path: /probe
params:
module: [http_2xx]
static_configs:
- targets:
- 'http://192.168.5.221:3000'
relabel_configs:
- source_labels: [__address__]
target_label: __param_target
- source_labels: [__param_target]
target_label: instance
- target_label: __address__
replacement: 10.19.0.1:9115 # The blackbox exporter's real hostname:port.
# icmp 监控
- job_name: 'hci-icmp-monitor'
scrape_interval: 1m
metrics_path: /probe
params:
module: [ "icmp" ]
static_configs:
- targets:
- 192.168.5.254
- 192.168.5.221
- 192.168.5.222
- 192.168.5.187
relabel_configs:
- source_labels: [__address__]
target_label: __param_target
- source_labels: [__param_target]
target_label: instance
- target_label: __address__
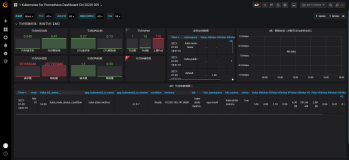
replacement: 10.19.0.1:9115 # The blackbox exporter's real hostname:port.Grafana 导入 Dashboard-ID:7587