
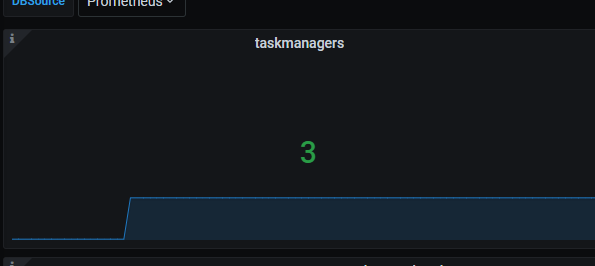
 实际就只有一个,但是重新启动了2次,说明之前的缓存数据还在,
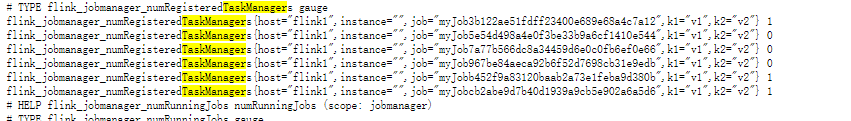 ,大佬有什么解决思路没,时间拉取以前的数据删掉?
版权声明:本文内容由阿里云实名注册用户自发贡献,版权归原作者所有,阿里云开发者社区不拥有其著作权,亦不承担相应法律责任。具体规则请查看《阿里云开发者社区用户服务协议》和《阿里云开发者社区知识产权保护指引》。如果您发现本社区中有涉嫌抄袭的内容,填写侵权投诉表单进行举报,一经查实,本社区将立刻删除涉嫌侵权内容。
配置Prometheus
修改Prometheus根目录prometheus.yml文件的scrape_config,如下图所示: scrape_configs: # The job name is added as a label job=<job_name> to any timeseries scraped from this config. - job_name: 'pushgateway'
# metrics_path defaults to '/metrics'
# scheme defaults to 'http'.

static_configs:
- targets: ['10.180.210.172:9091']
  labels:
    instance: 'pushgateway'
job_name: 'linux' static_configs:
job_name: prometheus static_configs:
启动prometheus, node_exporter和pushgateway
在命令行启动prometheus, node_exporter和pushgateway。
通过访问组件对应的URL确定是否成功启动。 端口号:
prometheus: 9090
node_exporter: 9100
pushgateway: 9091
来源:简书 著作权归作者所有。商业转载请联系作者获得授权,非商业转载请注明出处。
