How to use Chrome HAR save HTTP performance

简介: How to use Chrome HAR save HTTP performance

For performance analysis we would like to archive the detail performance for each HTTP. Chrome provide an useful tool—HAR to help us save and reuse the HTTP performance. Let’s have a look together.

Basic info: HAR (HTTP Archive) is a file format used by several http session tools to export the captured data.

1, Press F12 and open the debug mode.

Right click on the HTTP and choose “Save as HAR context”.

You will get the downloaded file with .har postfix.


image.png


2, Access below HTTP. it’s online translate website.

https://toolbox.googleapps.com/apps/har_analyzer/

image.png

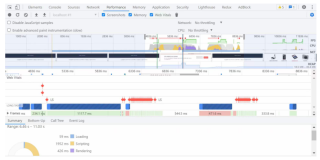
3,You can got the performance graphic.

image.png

相关文章
|
8月前
|
Web App开发 前端开发 开发者
什么是 Chrome 开发者工具 performance 面板 Experience 里的 Layout shift
|
Web App开发 前端开发 开发者
什么是 Chrome 开发者工具 performance 面板 Experience 里的 Layout shift
136 0
|
Web App开发 SQL JavaScript
【性能】7分钟带你了解【尤大】都在使用的 Chrome Runtime Performance Debug!
前段时间用Vue3开发了一个线上标准的项目,也都已经提测了,最近可以抽时间来整理一下项目中用到的技术栈,( 我用前端【最新】技术栈完成了一个生产标准的项目【Vue3 + TS + Vite + Pinia + Windicss + NavieUI】。 在开发之前特地重温了一下18年尤大的VUE CONF(杭州),过程中发现尤大使用到了这个Performance去分析JavaScript每一帧的计算,之前知道这个工具,但是平时基本不怎么用,借此机会学一下并做一些记录。
193 0
|
Web App开发 JavaScript 前端开发
如何使用 Chrome 开发者工具 Performance tab 分析 JavaScript 的执行瓶颈
109 0
如何使用 Chrome 开发者工具 Performance tab 分析 JavaScript 的执行瓶颈
|
Web App开发 UED 开发者
Chrome 开发者工具 performance 标签页的用法
|
Web App开发 tengine 安全
Understanding HTTP/2: History, Features, Debugging, and Performance
HTTP/2 is an optimized transfer protocol over the previous version and offers various advantages, such as increased security, simplified development p.
1983 0
|
Web App开发 JavaScript 前端开发
Chrome 开发工具之Timeline/Performance
之前有说到Element,Console,Sources大多运用于debug,Network可用于debug和查看性能,今天的主角Timeline(现已更名Performance)更多的是用在性能优化方面,它的作用就是记录与分析应用程序运行过程中所产生的活动。
1265 0
|
存储 Web App开发 监控
<!DOCTYPE html PUBLIC "-//W3C//DTD XHTML 1.0 Transitional//EN" "http://www.w3.org/TR/xhtml1/DTD/xhtml1-strict.dtd"> <html><head><meta http-equiv="Cont
我们以前使用过的对hbase和hdfs进行健康检查,及剩余hdfs容量告警,简单易用 1.针对hadoop2的脚本: #/bin/bashbin=`dirname $0`bin=`cd $bin;pwd`STATE_OK=...
1023 0
|
Web App开发 新零售 前端开发
<!DOCTYPE html PUBLIC "-//W3C//DTD XHTML 1.0 Transitional//EN" "http://www.w3.org/TR/xhtml1/DTD/xhtml1-strict.dtd"> <html><head><meta http-equiv="Cont
1.尽可能地了解需求,系统层面适用开闭原则 2.模块化,低耦合,能快速响应变化,也可以避免一个子系统的问题波及整个大系统 3.
719 0
|
Web App开发 前端开发 Java
<!DOCTYPE html PUBLIC "-//W3C//DTD XHTML 1.0 Transitional//EN" "http://www.w3.org/TR/xhtml1/DTD/xhtml1-strict.dtd"> <html><head><meta http-equiv="Cont
线程的状态有:new、runnable、running、waiting、timed_waiting、blocked、dead 当执行new Thread(Runnabler)后,新创建出来的线程处于new状态,这种线程不可能执行 当执行thread.start()后,线程处于runnable状态,这种情况下只要得到CPU,就可以开始执行了。
700 0