三、边框与装饰组件
3.1 边框组件在大屏设计中的重要性
在大屏可视化中,边框不仅仅是容器的边界,更是视觉层次划分的重要工具。
一个设计精美的边框可以让页面立刻提升一个档次。反之,简陋的边框会让整个大屏显得廉价。边框的作用可以归纳为:
区域划分:不同的信息模块之间通过边框区分,让用户更容易理解信息结构
视觉锚点:边框可以吸引用户的视线,引导用户按设计意图浏览内容
品牌传达:通过边框的样式(线条风格、色彩、装饰元素)可以传达品牌调性
科技感营造:动态流光、光点闪烁、网格装饰等元素可以营造科技感
大屏场景下的边框设计与普通网页不同,它更注重“氛围感”和“动态效果”。因此,边框组件通常需要支持渐变、光效、动画等高级特性。
3.2 边框组件的类型
常见的内部库中,边框组件通常分为以下几个类型: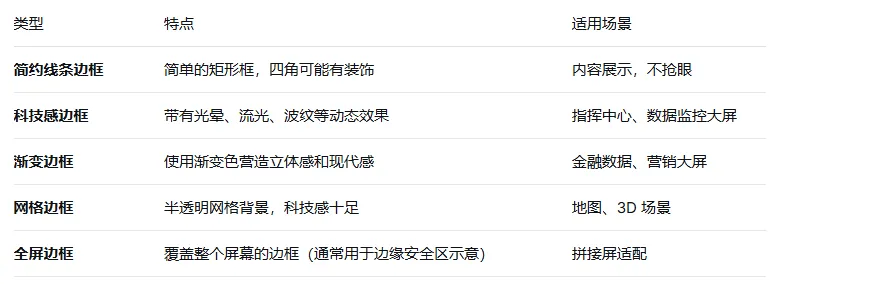
3.3 边框组件的 API 设计
一个设计良好的边框组件应该具备以下灵活的配置能力:
<template>
  <BorderBox
    // 基础配置
    width="100%"
    height="100%"

    // 边框样式
    type="tech"                    // 边框类型:line/tech/gradient/grid/full
    color="['#00ffff', '#0066ff']" // 渐变色
    border-width="4"               // 边框宽度(px)
    border-radius="8"              // 圆角大小
    background="rgba(0,0,0,0.3)"   // 背景色

    // 动画配置
    animate="true"                 // 是否开启动画
    animate-speed="3"              // 流光动画速度(秒/周期)
    animate-direction="left"       // 流光方向:left/right/up/down

    // 装饰元素
    show-corners="true"            // 是否显示四角装饰
    corner-size="16"               // 四角装饰大小
    show-lights="true"             // 是否显示光点装饰
    lights-count="8"               // 光点数量

    // 事件
    @click="handleClick"
  >
    <div class="box-content">
      <!-- 内容区域,插槽 -->
    </div>
  </BorderBox>
</template>
3.4 自定义科技感边框的实现
下面是一个带有流光动画和四角装饰的科技感边框实现示例:
<template>
  <div class="tech-border" :style="containerStyle">
    <div class="border-content">
      <slot></slot>
    </div>

    <!-- 四角装饰 -->
    <template v-if="showCorners">
      <div class="corner corner-tl"></div>
      <div class="corner corner-tr"></div>
      <div class="corner corner-bl"></div>
      <div class="corner corner-br"></div>
    </template>

    <!-- 流光线条 -->
    <div v-if="animate" class="light-stream" :style="streamStyle"></div>

    <!-- 光点装饰 -->
    <template v-if="showLights">
      <div v-for="i in lightsCount" :key="i" class="light-dot" :style="getLightStyle(i)"></div>
    </template>
  </div>
</template>

<script setup>
import { computed } from 'vue'

const props = defineProps({
  width: { type: String, default: '100%' },
  height: { type: String, default: '100%' },
  color: { type: Array, default: () => ['#00ffff', '#0066ff'] },
  borderWidth: { type: Number, default: 2 },
  borderRadius: { type: Number, default: 8 },
  background: { type: String, default: 'rgba(0, 0, 0, 0.3)' },
  animate: { type: Boolean, default: true },
  animateSpeed: { type: Number, default: 3 },
  showCorners: { type: Boolean, default: true },
  cornerSize: { type: Number, default: 16 },
  showLights: { type: Boolean, default: true },
  lightsCount: { type: Number, default: 8 }
})

const containerStyle = computed(() => ({
  width: props.width,
  height: props.height,
  background: props.background,
  borderWidth: `${props.borderWidth}px`,
  borderStyle: 'solid',
  borderImage: `linear-gradient(135deg, ${props.color.join(', ')}) 1`,
  borderRadius: `${props.borderRadius}px`,
  position: 'relative',
  overflow: 'hidden'
}))

const streamStyle = computed(() => ({
  position: 'absolute',
  top: 0,
  left: '-100%',
  width: '100%',
  height: `${props.borderWidth * 2}px`,
  background: `linear-gradient(90deg, transparent, ${props.color[0]}, transparent)`,
  animation: `streamMove ${props.animateSpeed}s linear infinite`
}))

const getLightStyle = (index) => {
  const angle = (index / props.lightsCount) * 360
  return {
    position: 'absolute',
    width: '6px',
    height: '6px',
    background: props.color[0],
    borderRadius: '50%',
    boxShadow: `0 0 8px ${props.color[0]}`,
    top: `${Math.sin(angle * Math.PI / 180) * 50 + 50}%`,
    left: `${Math.cos(angle * Math.PI / 180) * 50 + 50}%`,
    animation: `pulse 2s ease-in-out ${index * 0.2}s infinite`
  }
}
</script>

<style scoped>
@keyframes streamMove {
  0% { left: -100%; }
  100% { left: 100%; }
}

@keyframes pulse {
  0%, 100% { opacity: 0.3; transform: scale(0.8); }
  50% { opacity: 1; transform: scale(1.2); }
}

.corner {
  position: absolute;
  width: v-bind('props.cornerSize + "px"');
  height: v-bind('props.cornerSize + "px"');
  border-color: v-bind('props.color[0]');
  border-style: solid;
}

.corner-tl {
  top: -1px;
  left: -1px;
  border-width: 2px 0 0 2px;
}

.corner-tr {
  top: -1px;
  right: -1px;
  border-width: 2px 2px 0 0;
}

.corner-bl {
  bottom: -1px;
  left: -1px;
  border-width: 0 0 2px 2px;
}

.corner-br {
  bottom: -1px;
  right: -1px;
  border-width: 0 2px 2px 0;
}
</style>
四、图表组件
4.1 ECharts 的集成与封装
在大屏可视化项目中,ECharts 是最常用的图表库。它功能强大、社区活跃、文档完善,几乎可以满足各种图表需求。然而,在大屏场景下,直接使用 ECharts 会存在一些问题:
响应式问题:ECharts 不会自动监听容器大小变化,需要通过 resize() 手动更新
主题适配:大屏通常使用深色背景,ECharts 默认主题为浅色,需要定制主题
数据驱动:ECharts 本身不包含数据管理能力,需要与 Vue 的数据绑定机制集成
性能问题:大数据量渲染时,ECharts 可能会卡顿,需要优化
因此,封装一个通用的图表组件是必要的。一个好的图表封装应该解决上述问题。
4.2 图表组件的设计思路
下面是一个完整的 ECharts 图表组件的封装思路:
<template>
  <div ref="chartRef" class="chart-container" :style="containerStyle"></div>
</template>

<script setup>
import { ref, onMounted, onBeforeUnmount, watch, nextTick } from 'vue'
import * as echarts from 'echarts'

const props = defineProps({
  // 图表配置选项(核心)
  option: { type: Object, required: true },
  // 图表主题(light/dark)
  theme: { type: String, default: 'dark' },
  // 容器宽度(默认 100%)
  width: { type: String, default: '100%' },
  // 容器高度(默认 400px)
  height: { type: String, default: '400px' },
  // 是否启用自动适配窗口
  autoResize: { type: Boolean, default: true },
  // 数据更新前是否保留原有图形
  notMerge: { type: Boolean, default: false },
  // 加载状态
  loading: { type: Boolean, default: false },
  // 加载文案
  loadingText: { type: String, default: '数据加载中...' }
})

const chartRef = ref(null)
let chartInstance = null

// 容器样式
const containerStyle = computed(() => ({
  width: props.width,
  height: props.height
}))

// 初始化图表
const initChart = () => {
  if (chartInstance) {
    chartInstance.dispose()
  }
  chartInstance = echarts.init(chartRef.value, props.theme)
  chartInstance.setOption(props.option, props.notMerge)

  // 处理加载状态
  if (props.loading) {
    chartInstance.showLoading({
      text: props.loadingText,
      color: '#00ffff',
      textColor: '#ffffff',
      maskColor: 'rgba(0, 0, 0, 0.3)'
    })
  }
}

// 更新图表配置
const updateChart = () => {
  if (!chartInstance) return
  chartInstance.setOption(props.option, props.notMerge)
}

// 处理窗口大小变化
const handleResize = () => {
  chartInstance?.resize()
}

// 暴露给父组件的方法(用于外部调用)
defineExpose({
  getInstance: () => chartInstance,
  resize: () => chartInstance?.resize(),
  showLoading: () => chartInstance?.showLoading(),
  hideLoading: () => chartInstance?.hideLoading(),
  clear: () => chartInstance?.clear()
})

// 监听 option 变化,动态更新图表
watch(() => props.option, () => {
  updateChart()
}, { deep: true })

// 监听 loading 状态变化
watch(() => props.loading, (newVal) => {
  if (!chartInstance) return
  if (newVal) {
    chartInstance.showLoading({ text: props.loadingText })
  } else {
    chartInstance.hideLoading()
  }
})

onMounted(() => {
  nextTick(() => {
    initChart()
    if (props.autoResize) {
      window.addEventListener('resize', handleResize)
    }
  })
})

onBeforeUnmount(() => {
  if (props.autoResize) {
    window.removeEventListener('resize', handleResize)
  }
  if (chartInstance) {
    chartInstance.dispose()
    chartInstance = null
  }
})
</script>

<style scoped>
.chart-container {
  width: 100%;
  height: 100%;
}
</style>
4.3 图表配置的最佳实践
在大屏场景下,图表的配置与普通场景有所不同。以下是一些最佳实践:
1.深色主题适配
大屏背景通常为深色,图表的配色需要与背景协调:
const chartOption = {
  // 背景色透明(继承父容器背景)
  backgroundColor: 'transparent',
  // 全局文字颜色(浅色)
  textStyle: { color: '#ffffff' },
  // 图例文字颜色
  legend: { textStyle: { color: '#ffffff' } },
  // 坐标轴线样式
  xAxis: {
    axisLine: { lineStyle: { color: '#888888' } },
    axisLabel: { color: '#cccccc' }
  },
  yAxis: {
    axisLine: { lineStyle: { color: '#888888' } },
    axisLabel: { color: '#cccccc' }
  }
}
2.高亮配色
大屏中需要突出的关键数据(如最高点、预警值),使用高饱和度的亮色:
series: [{
  data: [12, 19, 3, 5, 2, 3],
  itemStyle: {
    color: '#00ffff',        // 正常数据色
    borderColor: '#ffffff',
    borderWidth: 1,
    shadowBlur: 10,
    shadowColor: 'rgba(0, 255, 255, 0.5)'
  },
  emphasis: {
    focus: 'series',
    itemStyle: {
      color: '#ff6600',      // 高亮色
      shadowBlur: 20,
      shadowColor: 'rgba(255, 102, 0, 0.8)'
    }
  }
}]
3.动画效果
大屏场景下,图表的入场动画可以引导视线,增加科技感:
animation: true,
animationDuration: 1000,
animationEasing: 'cubicOut',
animationThreshold: 2000,  // 数据量超过阈值时禁用动画
4.4 常用图表配置模板
折线图配置(适合趋势展示):
const lineChartOption = {
  title: { text: '销售趋势', textStyle: { color: '#fff', fontSize: 16 } },
  tooltip: { trigger: 'axis', axisPointer: { type: 'shadow' } },
  grid: { top: '15%', left: '10%', right: '10%', containLabel: true },
  xAxis: {
    type: 'category',
    data: ['1月', '2月', '3月', '4月', '5月', '6月'],
    axisLabel: { color: '#aaa', fontSize: 12 },
    axisLine: { lineStyle: { color: '#444' } }
  },
  yAxis: {
    type: 'value',
    name: '销售额(万元)',
    nameTextStyle: { color: '#aaa' },
    axisLabel: { color: '#aaa' },
    splitLine: { lineStyle: { color: '#333' } }
  },
  series: [{
    name: '2024年',
    type: 'line',
    data: [120, 200, 150, 80, 70, 110],
    smooth: true,
    symbol: 'circle',
    symbolSize: 8,
    lineStyle: { width: 3, color: '#00ffff', shadowBlur: 10, shadowColor: '#00ffff' },
    areaStyle: { opacity: 0.3, color: new echarts.graphic.LinearGradient(0, 0, 0, 1, [
      { offset: 0, color: 'rgba(0, 255, 255, 0.5)' },
      { offset: 1, color: 'rgba(0, 255, 255, 0.0)' }
    ]) },
    itemStyle: { color: '#00ffff', borderColor: '#fff', borderWidth: 2 }
  }]
}
柱状图配置(适合对比展示):
const barChartOption = {
  tooltip: { trigger: 'axis', axisPointer: { type: 'shadow' } },
  grid: { top: '15%', left: '10%', right: '10%', containLabel: true },
  xAxis: {
    type: 'category',
    data: ['产品A', '产品B', '产品C', '产品D'],
    axisLabel: { color: '#aaa', rotate: 30 }
  },
  yAxis: {
    type: 'value',
    name: '销量(件)',
    nameTextStyle: { color: '#aaa' },
    axisLabel: { color: '#aaa' }
  },
  series: [{
    name: '销量',
    type: 'bar',
    data: [320, 280, 190, 150],
    itemStyle: {
      borderRadius: [4, 4, 0, 0],
      color: new echarts.graphic.LinearGradient(0, 0, 0, 1, [
        { offset: 0, color: '#00ffff' },
        { offset: 1, color: '#0066ff' }
      ]),
      shadowBlur: 10,
      shadowColor: 'rgba(0, 255, 255, 0.5)'
    },
    label: { show: true, position: 'top', color: '#fff', fontWeight: 'bold' },
    barWidth: '40%'
  }]
}
饼图/环形图配置(适合占比展示):
const pieChartOption = {
  tooltip: { trigger: 'item', formatter: '{b}: {d}%' },
  legend: {
    orient: 'vertical',
    left: 'left',
    textStyle: { color: '#fff' },
    itemWidth: 20,
    itemHeight: 12
  },
  series: [{
    name: '市场占比',
    type: 'pie',
    radius: ['40%', '70%'],
    avoidLabelOverlap: false,
    label: { show: true, formatter: '{b}: {d}%', color: '#fff' },
    emphasis: { scale: true, label: { show: true, fontWeight: 'bold' } },
    data: [
      { value: 35, name: '品牌A', itemStyle: { color: '#00ffff' } },
      { value: 28, name: '品牌B', itemStyle: { color: '#ff6600' } },
      { value: 20, name: '品牌C', itemStyle: { color: '#ff00ff' } },
      { value: 17, name: '其他', itemStyle: { color: '#00ff66' } }
    ]
  }]
}