前言
随着 Prometheus 监控的组件、数量、指标越来越多,Prometheus 对计算性能的要求会越来越高,存储占用也会越来越多。
在这种情况下,要优化 Prometheus 性能, 优化存储占用. 第一时间想到的可能是各种 Prometheus 的兼容存储方案, 如 Thanos 或 VM、Mimir 等。但是实际上虽然集中存储、长期存储、存储降采样及存储压缩可以一定程度解决相关问题,但是治标不治本。
- 真正的本,还是在于指标量(series)过于庞大。
- 治本之法,应该是减少指标量。有 2 种办法:
- Prometheus 性能调优 - 解决高基数问题
- 根据实际使用情况,只保留(keep)展示(Grafana Dashboards)和告警(prometheus rules)会用到的指标。
本次重点介绍第二种办法:如何根据实际的使用情况精简 Prometheus 的指标和存储占用?
思路
- 分析当前 Prometheus 中存储的所有的 metric name(指标项);
- 分析展示环节用到的所有 metric name,即 Grafana 的 Dashboards 用到的所有指标;
- 分析告警环节用到的所有 metric name,即 Prometheus Rule 配置中用到的所有指标;
- (可选)分析诊断环境用到的所有 metric name,即经常在 Prometheus UI 上 query 的指标;
- 通过
relabel在metric_relabel_configs或write_relabel_configs仅keep2-4 中的指标, 以此大幅减少 Prometheus 需要存储的指标量.
要具体实现这个思路, 可以通过 Grafana Labs 出品的 mimirtool 来搞定.
我这里有个前后的对比效果, 可供参考这样做效果有多惊人:
- 精简前: 270336 活动 series
- 精简后: 61055 活动 series
- 精简效果: 将近 5 倍的精简率!
Grafana Mimirtool
Grafana Mimir 是一款以对象存储为存储方式的 Prometheus 长期存储解决方案, 从 Cortex 演化而来. 官方号称支持亿级别的 series 写入存储和查询.
Grafana Mimirtool 是 Mimir 发布的一个实用工具, 可单独使用.
Grafana Mimirtool 支持从以下方面提取指标:
- Grafana 实例中的 Grafana Dashboards(通过 Grafana API)
- Mimir 实例中的 Prometheus alerting 和 recording rules
- Grafana Dashboards JSON 文件
- Prometheus 记 alerting 和 recording rules 的 YAML 文件
然后,Grafana Mimirtool 可以将这些提取的指标与 Prometheus 或 Cloud Prometheus 实例中的活动 series 进行比较,并输出一个 used 指标和 unused 指标的列表。
Prometheus 精简指标实战
假设
假定:
- 通过 kube-prometheus-stack 安装 Prometheus
- 已安装 Grafana 且作为展示端
- 已配置相应的 告警规则
- 除此之外, 无其他需要额外保留的指标
前提
- Grafana Mimirtool 从 releases 中找到 mimirtool 对应平台的版本下载即可使用;
- 已 创建 Grafana API token
- Prometheus已安装和配置.
第一步: 分析 Grafana Dashboards 用到的指标
通过 Grafana API
具体如下:
# 通过 Grafana API 分析 Grafana 用到的指标 # 前提是现在 Grafana 上创建 API Keys mimirtool analyze grafana --address http://172.16.0.20:32651 --key=eyJrIjoiYjBWMGVoTHZTY3BnM3V5UzNVem9iWDBDSG5sdFRxRVoiLCJuIjoibWltaXJ0b29sIiwiaWQiOjF9 BASH |
📝说明:
http://172.16.0.20:32651是 Grafana 地址--key=eyJr是 Grafana API Token. 通过如下界面获得:
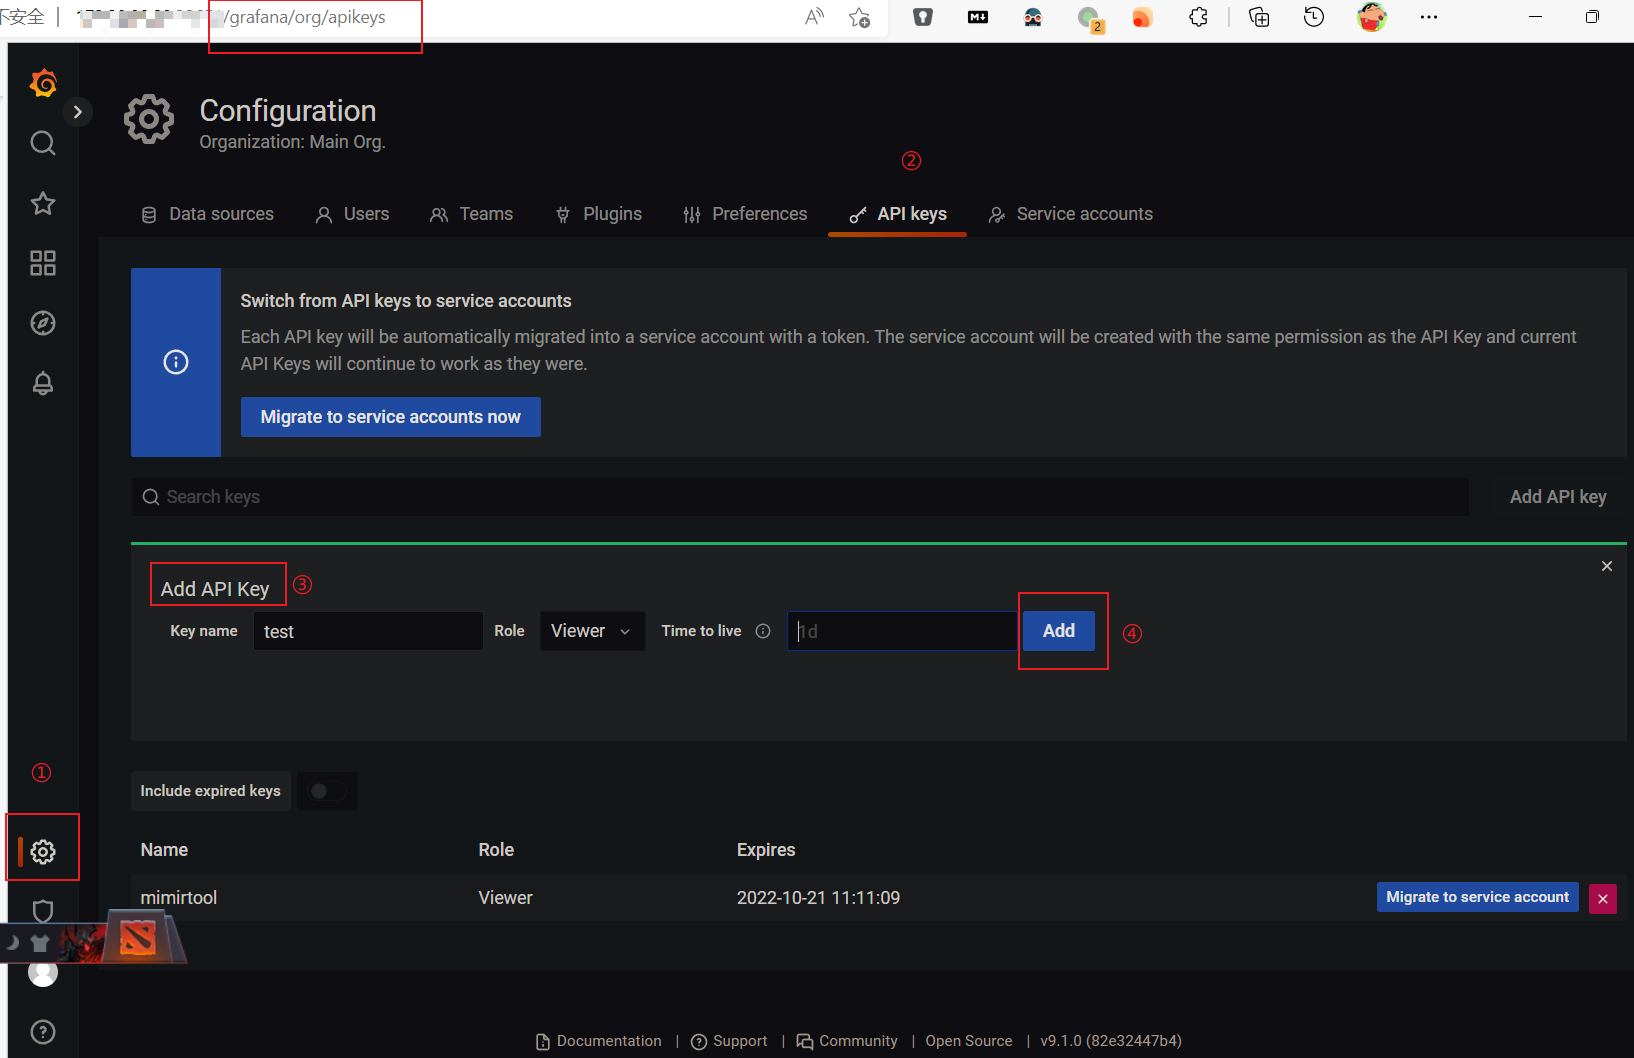 创建 Grafana API Token
获取到的是一个 metrics-in-grafana.json, 内容概述如下:
{ "metricsUsed": [ ":node_memory_MemAvailable_bytes:sum", "alertmanager_alerts", "alertmanager_alerts_invalid_total", "alertmanager_alerts_received_total", "alertmanager_notification_latency_seconds_bucket", "alertmanager_notification_latency_seconds_count", "alertmanager_notification_latency_seconds_sum", "alertmanager_notifications_failed_total", "alertmanager_notifications_total", "cluster", "cluster:namespace:pod_cpu:active:kube_pod_container_resource_limits", "cluster:namespace:pod_cpu:active:kube_pod_container_resource_requests", "cluster:namespace:pod_memory:active:kube_pod_container_resource_limits", "cluster:namespace:pod_memory:active:kube_pod_container_resource_requests", "cluster:node_cpu:ratio_rate5m", "container_cpu_cfs_periods_total", "container_cpu_cfs_throttled_periods_total", "..." ], "dashboards": [ { "slug": "", "uid": "alertmanager-overview", "title": "Alertmanager / Overview", "metrics": [ "alertmanager_alerts", "alertmanager_alerts_invalid_total", "alertmanager_alerts_received_total", "alertmanager_notification_latency_seconds_bucket", "alertmanager_notification_latency_seconds_count", "alertmanager_notification_latency_seconds_sum", "alertmanager_notifications_failed_total", "alertmanager_notifications_total" ], "parse_errors": null }, { "slug": "", "uid": "c2f4e12cdf69feb95caa41a5a1b423d9", "title": "etcd", "metrics": [ "etcd_disk_backend_commit_duration_seconds_bucket", "etcd_disk_wal_fsync_duration_seconds_bucket", "etcd_mvcc_db_total_size_in_bytes", "etcd_network_client_grpc_received_bytes_total", "etcd_network_client_grpc_sent_bytes_total", "etcd_network_peer_received_bytes_total", "etcd_network_peer_sent_bytes_total", "etcd_server_has_leader", "etcd_server_leader_changes_seen_total", "etcd_server_proposals_applied_total", "etcd_server_proposals_committed_total", "etcd_server_proposals_failed_total", "etcd_server_proposals_pending", "grpc_server_handled_total", "grpc_server_started_total", "process_resident_memory_bytes" ], "parse_errors": null }, {...} ] } JSON |
(可选)通过 Grafana Dashboards json 文件
如果无法创建 Grafana API Token, 只要有 Grafana Dashboards json 文件, 也可以用来分析, 示例如下:
# 通过 Grafana Dashboard json 分析 Grafana 用到的指标 mimirtool analyze dashboard grafana_dashboards/blackboxexporter-probe.json mimirtool analyze dashboard grafana_dashboards/es.json BASH |
得到的 json 结构和上一节类似, 就不赘述了.
第二步: 分析 Prometheus Alerting 和 Recording Rules 用到的指标
具体操作如下:
# (可选)通过 kubectl cp 将用到的 rule files 拷贝到本地 kubectl cp <prompod>:/etc/prometheus/rules/<releasename>-kube-prometheus-st-prometheus-rulefiles-0 -c prometheus ./kube-prometheus-stack/rulefiles/ # 通过 Prometheus rule files 分析 Prometheus Rule 用到的指标(涉及 recording rule 和 alert rules) mimirtool analyze rule-file ./kube-prometheus-stack/rulefiles/* BASH |
结果如下 metrics-in-ruler.json:
{ "metricsUsed": [ "ALERTS", "aggregator_unavailable_apiservice", "aggregator_unavailable_apiservice_total", "apiserver_client_certificate_expiration_seconds_bucket", "apiserver_client_certificate_expiration_seconds_count", "apiserver_request_terminations_total", "apiserver_request_total", "blackbox_exporter_config_last_reload_successful", "..." ], "ruleGroups": [ { "namspace": "default-monitor-kube-prometheus-st-kubernetes-apps-ae2b16e5-41d8-4069-9297-075c28c6969e", "name": "kubernetes-apps", "metrics": [ "kube_daemonset_status_current_number_scheduled", "kube_daemonset_status_desired_number_scheduled", "kube_daemonset_status_number_available", "kube_daemonset_status_number_misscheduled", "kube_daemonset_status_updated_number_scheduled", "..." ] "parse_errors": null }, { "namspace": "default-monitor-kube-prometheus-st-kubernetes-resources-ccb4a7bc-f2a0-4fe4-87f7-0b000468f18f", "name": "kubernetes-resources", "metrics": [ "container_cpu_cfs_periods_total", "container_cpu_cfs_throttled_periods_total", "kube_node_status_allocatable", "kube_resourcequota", "namespace_cpu:kube_pod_container_resource_requests:sum", "namespace_memory:kube_pod_container_resource_requests:sum" ], "parse_errors": null }, {...} ] } JSON |
第三步: 分析没用到的指标
具体如下:
# 综合分析 Prometheus 采集到的 VS. (展示(Grafana Dashboards) + 记录及告警(Rule files)) mimirtool analyze prometheus --address=http://172.16.0.20:30090/ --grafana-metrics-file="metrics-in-grafana.json" --ruler-metrics-file="metrics-in-ruler.json" BASH |
📝说明:
--address=http://172.16.0.20:30090/为 prometheus 地址--grafana-metrics-file="metrics-in-grafana.json"为第一步得到的 json 文件--ruler-metrics-file="kube-prometheus-stack-metrics-in-ruler.json"为第二步得到的 json 文件
输出结果prometheus-metrics.json 如下:
{ "total_active_series": 270336, "in_use_active_series": 61055, "additional_active_series": 209281, "in_use_metric_counts": [ { "metric": "rest_client_request_duration_seconds_bucket", "count": 8855, "job_counts": [ { "job": "kubelet", "count": 4840 }, { "job": "kube-controller-manager", "count": 1958 }, {...} ] }, { "metric": "grpc_server_handled_total", "count": 4394, "job_counts": [ { "job": "kube-etcd", "count": 4386 }, { "job": "default/kubernetes-ebao-ebaoops-pods", "count": 8 } ] }, {...} ], "additional_metric_counts": [ { "metric": "rest_client_rate_limiter_duration_seconds_bucket", "count": 81917, "job_counts": [ { "job": "kubelet", "count": 53966 }, { "job": "kube-proxy", "count": 23595 }, { "job": "kube-scheduler", "count": 2398 }, { "job": "kube-controller-manager", "count": 1958 } ] }, { "metric": "rest_client_rate_limiter_duration_seconds_count", "count": 7447, "job_counts": [ { "job": "kubelet", "count": 4906 }, { "job": "kube-proxy", "count": 2145 }, { "job": "kube-scheduler", "count": 218 }, { "job": "kube-controller-manager", "count": 178 } ] }, {...} ] } JSON |
第四步: 仅 keep 用到的指标
在 write_relabel_configs 环节配置
如果你有使用 remote_write, 那么直接在 write_relabel_configs 环节配置 keep relabel 规则, 简单粗暴.
可以先用 jp 命令得到所有需要 keep 的 metric name:
jq '.metricsUsed' metrics-in-grafana.json \ | tr -d '", ' \ | sed '1d;$d' \ | grep -v 'grafanacloud*' \ | paste -s -d '|' - BASH |
输出结果类似如下:
instance:node_cpu_utilisation:rate1m|instance:node_load1_per_cpu:ratio|instance:node_memory_utilisation:ratio|instance:node_network_receive_bytes_excluding_lo:rate1m|instance:node_network_receive_drop_excluding_lo:rate1m|instance:node_network_transmit_bytes_excluding_lo:rate1m|instance:node_network_transmit_drop_excluding_lo:rate1m|instance:node_vmstat_pgmajfault:rate1m|instance_device:node_disk_io_time_seconds:rate1m|instance_device:node_disk_io_time_weighted_seconds:rate1m|node_cpu_seconds_total|node_disk_io_time_seconds_total|node_disk_read_bytes_total|node_disk_written_bytes_total|node_filesystem_avail_bytes|node_filesystem_size_bytes|node_load1|node_load15|node_load5|node_memory_Buffers_bytes|node_memory_Cached_bytes|node_memory_MemAvailable_bytes|node_memory_MemFree_bytes|node_memory_MemTotal_bytes|node_network_receive_bytes_total|node_network_transmit_bytes_total|node_uname_info|up COQ |
然后直接在 write_relabel_configs 环节配置 keep relabel 规则:
remote_write: - url: <remote_write endpoint> basic_auth: username: < 按需 > password: < 按需 > write_relabel_configs: - source_labels: [__name__] regex: instance:node_cpu_utilisation:rate1m|instance:node_load1_per_cpu:ratio|instance:node_memory_utilisation:ratio|instance:node_network_receive_bytes_excluding_lo:rate1m|instance:node_network_receive_drop_excluding_lo:rate1m|instance:node_network_transmit_bytes_excluding_lo:rate1m|instance:node_network_transmit_drop_excluding_lo:rate1m|instance:node_vmstat_pgmajfault:rate1m|instance_device:node_disk_io_time_seconds:rate1m|instance_device:node_disk_io_time_weighted_seconds:rate1m|node_cpu_seconds_total|node_disk_io_time_seconds_total|node_disk_read_bytes_total|node_disk_written_bytes_total|node_filesystem_avail_bytes|node_filesystem_size_bytes|node_load1|node_load15|node_load5|node_memory_Buffers_bytes|node_memory_Cached_bytes|node_memory_MemAvailable_bytes|node_memory_MemFree_bytes|node_memory_MemTotal_bytes|node_network_receive_bytes_total|node_network_transmit_bytes_total|node_uname_info|up action: keep YAML |
在 metric_relabel_configs 环节配置
如果没有使用 remote_write, 那么只能在 metric_relabel_configs 环节配置了.
以 etcd job 为例: (以 prometheus 配置为例, Prometheus Operator 请自行按需调整)
- job_name: serviceMonitor/default/monitor-kube-prometheus-st-kube-etcd/0 honor_labels: false kubernetes_sd_configs: - role: endpoints namespaces: names: - kube-system scheme: https tls_config: insecure_skip_verify: true ca_file: /etc/prometheus/secrets/etcd-certs/ca.crt cert_file: /etc/prometheus/secrets/etcd-certs/healthcheck-client.crt key_file: /etc/prometheus/secrets/etcd-certs/healthcheck-client.key relabel_configs: - source_labels: - job target_label: __tmp_prometheus_job_name - ... metric_relabel_configs: - source_labels: [__name__] regex: etcd_disk_backend_commit_duration_seconds_bucket|etcd_disk_wal_fsync_duration_seconds_bucket|etcd_mvcc_db_total_size_in_bytes|etcd_network_client_grpc_received_bytes_total|etcd_network_client_grpc_sent_bytes_total|etcd_network_peer_received_bytes_total|etcd_network_peer_sent_bytes_total|etcd_server_has_leader|etcd_server_leader_changes_seen_total|etcd_server_proposals_applied_total|etcd_server_proposals_committed_total|etcd_server_proposals_failed_total|etcd_server_proposals_pending|grpc_server_handled_total|grpc_server_started_total|process_resident_memory_bytes|etcd_http_failed_total|etcd_http_received_total|etcd_http_successful_duration_seconds_bucket|etcd_network_peer_round_trip_time_seconds_bucket|grpc_server_handling_seconds_bucket|up action: keep YAML |
不用 keep 而使用 drop
同样滴, 不用 keep 而改为使用 drop 也是可以的. 这里不再赘述.
🎉🎉🎉
总结
本文中,介绍了精简 Prometheus 指标的需求, 然后说明如何使用 mimirtool analyze 命令来确定 Grafana Dashboards 以及 Prometheus Rules 中用到的指标。然后用 analyze prometheus 分析了展示和告警中used 和 unused 的活动 series,最后配置了 Prometheus 以仅 keep 用到的指标。
结合这次实战, 精简率可以达到 5 倍左右, 效果还是非常明显的. 推荐试一试. 👍️👍️👍️