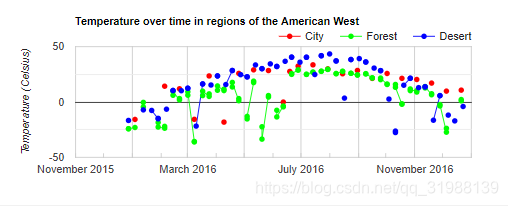

最后显示的效果就是上图,城市,森林和荒漠的不同时候的温度
折起没有什么难度,所以直接上代码:
总而言之,就是先把影像和区域弄好,然后设置自己的要遍历的内容,最后成图,成图的部分分为三点,第一个是设置影像中最合性的内容,也就是你要选择ui.Chart.image.后面的内容,然后设置你选择要出图的类型,最后设置图上的一些标题大小等等。
ui.Chart.image
ui.Chart.image.byClass(image, classBand, region, reducer, scale, classLabels, xLabels)
ui.Chart.image.byRegion(image, regions, reducer, scale, xProperty)
ui.Chart.image.doySeries(imageCollection, region, regionReducer, scale, yearReducer, startDay, endDay)
ui.Chart.image.doySeriesByRegion(imageCollection, bandName, regions, regionReducer, scale, yearReducer, seriesProperty, startDay, endDay)
ui.Chart.image.doySeriesByYear(imageCollection, bandName, region, regionReducer, scale, sameDayReducer, startDay, endDay)
ui.Chart.image.histogram(image, region, scale, maxBuckets, minBucketWidth, maxRaw, maxPixels)
ui.Chart.image.regions(image, regions, reducer, scale, seriesProperty, xLabels)
ui.Chart.image.series(imageCollection, region, reducer, scale, xProperty)
ui.Chart.image.seriesByRegion(imageCollection, regions, reducer, band, scale, xProperty, seriesProperty)
// 先分别设置不同区域的颜色
var COLOR = {
  CITY: 'ff0000',
  DESERT: '0000ff',
  FOREST: '00ff00'
};
//之前我们觉得例子是点,这次我们选择面,同样是三个句型选择区域,分别给标签命名,最后作为你散点图上的图例
var city = ee.Feature(    // San Francisco.
    ee.Geometry.Rectangle(-122.45, 37.74, -122.4, 37.8),
    {label: 'City'});
var forest = ee.Feature(  // Tahoe National Forest.
    ee.Geometry.Rectangle(-121, 39.4, -120.8, 39.8),
    {label: 'Forest'});
var desert = ee.Feature(  // Black Rock Desert.
    ee.Geometry.Rectangle(-119.15, 40.8, -119, 41),
    {label: 'Desert'});
//将多个句型放在一个矢量集合当中,注意,这里是以名字放入一个列表当中
var westernRegions = new ee.FeatureCollection([city, forest, desert]);
// Get brightness temperature data for 1 year.
var landsat8Toa = ee.ImageCollection('LANDSAT/LC08/C01/T1_TOA');
var temps2013 = landsat8Toa.filterBounds(westernRegions)
    .filterDate('2015-12-25', '2016-12-25')
    .select('B10');
//B10 Thermal infrared 1, resampled from 100m to 30m  30 meters 10.60 - 11.19 µm
// 从B10波段的热红外波段值转化为温度值
temps2013 = temps2013.map(function(image) {
  return image.addBands(image.subtract(273.15).select([0], ['Temp']));
//返回值是一个运算玩的温度值,并且添加波段在第一个,并且命名为Temp
});
// 这个就是设置时间序列的影像了,区域加载进来,平求出平均值
var tempTimeSeries = ui.Chart.image.seriesByRegion({
  imageCollection: temps2013,
  regions: westernRegions,
  reducer: ee.Reducer.mean(),
  band: 'Temp',
  scale: 200,
  xProperty: 'system:time_start',
  seriesProperty: 'label'
});
//设置图标的类型
tempTimeSeries.setChartType('ScatterChart');
//设置图标类型的参数
tempTimeSeries.setOptions({
  title: 'Temperature over time in regions of the American West',
  vAxis: {
    title: 'Temperature (Celsius)'
  },
  lineWidth: 1,
  pointSize: 4,
  series: {
    0: {color: COLOR.CITY},
    1: {color: COLOR.FOREST},
    2: {color: COLOR.DESERT}
  }
});
//最后答应出来
print(tempTimeSeries);
Map.addLayer(desert, {color: COLOR.DESERT});
Map.addLayer(forest, {color: COLOR.FOREST});
Map.addLayer(city, {color: COLOR.CITY});
Map.setCenter(-121, 39.4, 6);