本次是加载一个折线图在地图上,主要是展现波段的平均值,重点是如何放在地图上,先看重点:
ui.Chart.image.series(imageCollection, region, reducer, scale, xProperty)
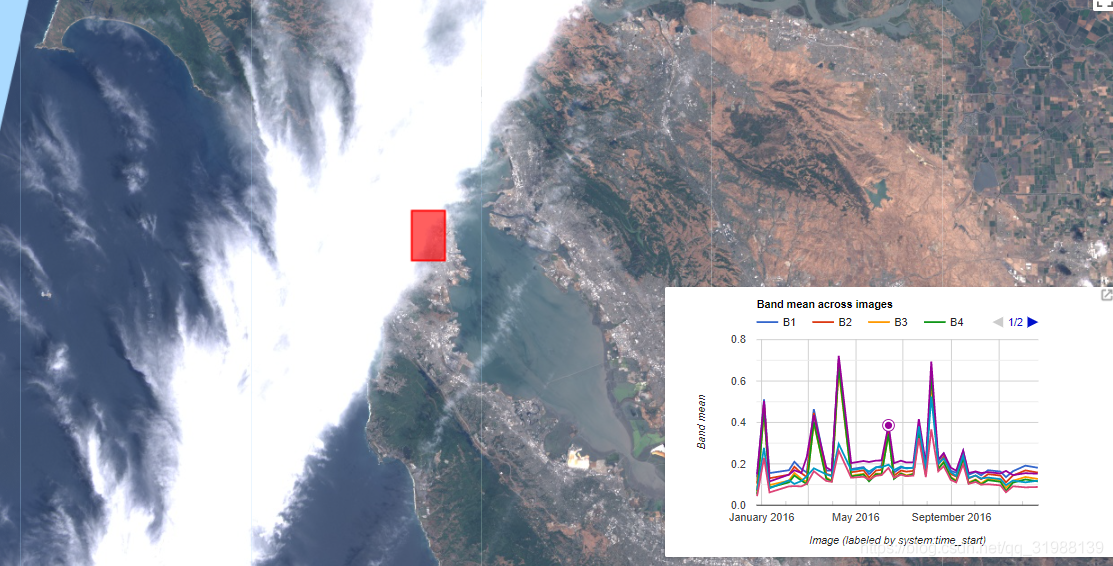
Generates a Chart from an ImageCollection. Plots derived values of each band in a region across images. Usually a time series.
- X-axis: Image, labeled by xProperty value.
- Y-axis: Band value.
- Series: Band names.//波段名字作为序列也就是要显示的内容
Returns a chart.
Arguments:参数中没有什么差异,和之前的都一样
imageCollection (ImageCollection):
An ImageCollection with data to be included in the chart.
region (Feature|FeatureCollection|Geometry):
The region to reduce.
reducer (Reducer, optional):
Reducer that generates the values for the y-axis. Must return a single value. Defaults to ee.Reducer.mean().
scale (Number, optional):
Scale to use with the reducer in meters.
xProperty (String, optional):
Property to be used as the label for each image on the x-axis. Defaults to 'system:time_start'.
Returns: ui.Chart
这个是网地图上加盖图标
ui.Map.Layer(eeObject, visParams, name, shown, opacity)
A layer generated from an Earth Engine object for display on a ui.Map.
Arguments:
eeObject (Collection|Feature|Image, optional)://这里可以是一个影像、矢量或者集合
The object to add to the map. Defaults to an empty ee.Image.默认是一个空的对象
visParams (FeatureVisualizationParameters|ImageVisualizationParameters, optional):
The visualization parameters. See ee.data.getMapId() docs.
name (String, optional):
The name of the layer.
shown (Boolean, optional):
Whether the layer is initially shown. Defaults to true.
opacity (Number, optional):
The layer's opacity represented as a number between 0 and 1. Defaults to 1.
Returns: ui.Map.Layer
当然在最后如果你想加载这上面的化,还需要Map.layers().add(sfLayer);
如何在地图上创造一个标签:直接用ui.Label(“标签显示的内容”)
同样想要实现还得继续用Map.add(label)
如何实现自己加载的线型图的点击?
Map.onClick(callback)
Registers a callback that's fired when the map is clicked.通过点击返回一个值,返回什么东西需要自己写个函数来确定,并让他显示在标签上
Returns an ID which can be passed to unlisten() to unregister the callback.
Arguments:
callback (Function):
The callback to fire when the map is clicked. The callback is passed an object containing the coordinates of the clicked point (with keys lon and lat) and the map widget.
Returns: String
reset(list)
Replaces all elements in list with a new list or, if no list is provided, removes all elements from list.
Returns the elements in the list after the reset is applied.一个列表,选择你要加载的影像显示值和这个点的符号颜色。
Arguments:
this:ui.data.activelist (ui.data.ActiveList):
The ui.data.ActiveList instance.
list (List<Object>, optional):
A list of elements.
Returns: List<Object>
ui.label有一个属性值
setValue(value)
Sets the value of the label.
Returns this label.
Arguments:
this:ui.label (ui.Label):
The ui.Label instance.
value (String):
The value of the label.
Returns: ui.Label


最后来看一下这一系列复杂的过程的代码:
//选择需要研究的区域,给对焦点坐标形成矩形
var sanFrancisco =
    ee.Geometry.Rectangle(-122.45, 37.74, -122.4, 37.8);
//筛选影像时间和波段的选取
var landsat8Toa = ee.ImageCollection('LANDSAT/LC08/C01/T1_TOA')
    .filterDate('2015-12-25', '2016-12-25')
    .select('B[1-7]');
// 创造一个随时间变化的折线图.
var chart = ui.Chart.image.series({
  imageCollection: landsat8Toa,
  region: sanFrancisco,
  reducer: ee.Reducer.mean(),
  scale: 200
});
//让上面的折线图设置属性并加载到map上
chart.style().set({
  position: 'bottom-right',
  width: '500px',
  height: '300px'
});
Map.add(chart);
// 这个是设置你研究区域要在地图上显示的颜色,设置属性并加载在地图上同时设置地图显示的中心点坐标.
var sfLayer = ui.Map.Layer(sanFrancisco, {color: 'FF0000'}, 'SF');
Map.layers().add(sfLayer);
Map.setCenter(-122.47, 37.7, 9);
// 创造一个标签在地图上.
var label = ui.Label('Click a point on the chart to show the image for that date.');
Map.add(label);
// 设置点击,通过点击可以在标签上显示你想要的东西,是动态的实时的.
chart.onClick(function(xValue, yValue, seriesName) {
  if (!xValue) return;  // Selection was cleared.
  // 当点击你图标上的时间点的时候,你就可以显示当期的影像.
  var equalDate = ee.Filter.equals('system:time_start', xValue);
  var image = ee.Image(landsat8Toa.filter(equalDate).first());
  var l8Layer = ui.Map.Layer(image, {
    gamma: 1.3,
    min: 0,
    max: 0.3,
    bands: ['B4', 'B3', 'B2']
  });
  Map.layers().reset([l8Layer, sfLayer]);
  // 在标签上显示这个时间节点的影像.
  label.setValue((new Date(xValue)).toUTCString());
});
这个自己慢慢研究吧,过程还是比较累的,毕竟你需要完成很多内置功能!