为了比较方便统计微服务服务器基础指标和相关运行状态,目前比较流行和成熟的方案是采用Prometheus+Grafana。本文主要基于docker的方式,快速搭建一套监控体系。
- 应用改造
为了整合Prometheus,需要在微服务应用中增加micrometer-registry-prometheus依赖:
<!-- Micrometer Prometheus registry  -->
<dependency>
    <groupId>io.micrometer</groupId>
    <artifactId>micrometer-registry-prometheus</artifactId>
</dependency>
配置中打开端点/actuator/prometheus
management:
  endpoints:
    web:
      exposure:
        include: "*"
  endpoint:
    health:
      show-details: ALWAYS
  metrics:
    tags:
application: ${spring.application.name}- 启动prometheus
运行prometheus容器:
$ docker run -d --name=prometheus -p 9090:9090 -v /docker/prometheus/prometheus.yml:/etc/prometheus/prometheus.yml prom/prometheus:v2.16.0 --config.file=/etc/prometheus/prometheus.yml其中映射到主机的配置文件prometheus.yml的配置如下:
# my global config
global:
  scrape_interval:     15s # Set the scrape interval to every 15 seconds. Default is every 1 minute.
  evaluation_interval: 15s # Evaluate rules every 15 seconds. The default is every 1 minute.
  # scrape_timeout is set to the global default (10s).

# Load rules once and periodically evaluate them according to the global 'evaluation_interval'.
# rule_files:
  # - "first_rules.yml"
  # - "second_rules.yml"

# A scrape configuration containing exactly one endpoint to scrape:
# Here it's Prometheus itself.
scrape_configs:
  # The job name is added as a label `job=<job_name>` to any timeseries scraped from this config.
  - job_name: 'prometheus'
    # metrics_path defaults to '/metrics'
    # scheme defaults to 'http'.
    static_configs:
      - targets: ['127.0.0.1:9090']

  - job_name: 'nacos-prometheus'
    metrics_path: '/actuator/prometheus'
    scrape_interval: 15s
    consul_sd_configs:
      - server: '192.168.0.102:7000'
services: []- 启动Grafana
使用以下命令可以使Docker下载和运行Grafana:
$ docker run -d --name=grafana -p 3000:3000 grafana/grafana为了能让Grafana的面板嵌入到应用中,需要更改配置
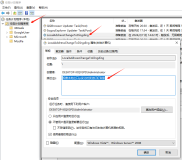
以root用户进入容器中
$ docker exec -u root -it grafana sh
# vi conf/defaults.ini

- 导入模版
使用dashboard模版,可以减少定制的时间。官网的dashboard广场,有很多现成的:
https://grafana.com/grafana/dashboards
在Grafana的面板中点击菜单Import:

从官网dashboard广场获取面板ID:
此处粘贴入模版ID:
微服务应用,推荐使用4701
- 将Grafana嵌入自己的应用页面
dashboard 和 panel都可以分享,如图点击share:
弹出的对话框中,可以自定义一些参数
分享出来的链接加入kiosk=tv参数还可以隐藏面板的左边菜单和上面标题栏。然后就可以用iframe标签嵌入到前端页面里去了。
- 告警配置
如需告警,则需要把配置文件中的这个地址改下,否则docker里的会是错误的
在Grafana的Alert面板中,可以根据需要配置告警的一些参数,如监测频率等

- 生成图文告警
首先在Grafana的Notification channels面板中配置告警通道:
有2个参数必须注意,Url填入告警分发的钉钉机器人的webhook。如何添加群机器人并获得webkook,请参考钉钉官网https://ding-doc.dingtalk.com/doc#/serverapi2/krgddi。此外,要注意勾选 Include image 选项。
配置好后,Grafana的告警图表还需要一个外部的图像渲染服务。我们依然使用docker来创建并启动此服务,
新建容器并对外开放8081端口:
$ docker run -d --name=grafana-image-renderer -p 8081:8081 --env GF_RENDERER_PLUGIN_TZ=Asia/Shanghai --env GF_RENDERER_PLUGIN_IGNORE_HTTPS_ERRORS=true grafana/grafana-image-renderer进入容器中修改配置文件 /conf/defaults.ini
[rendering]
# 这里指定使用外部图像渲染,指向刚建立的容器 /render 路径不可少
server_url = http://192.168.0.102:8081/render
# If the remote HTTP image renderer service runs on a different server than the
callback_url = http://192.168.0.102:3000
还有:
[external_image_storage]
# 使用s3协议
provider = s3
[external_image_storage.s3]
# 这个链接必须要能连通互联网,否则图像能生成,但会无法访问
endpoint = http://www.xxx.com
# 这个参数必须设置成true,否则下面的bucket参数会加在上面endpoint最前面,导致访问不了,会变成 http://mybucket.www.xxx.com
path_style_access = true
# 不要配置
bucket_url =
bucket = mybucket
# minIO默认的region是us-east-1
region = us-east-1
path = images
access_key = AKIAIOSFODNN7EXAMPLE
secret_key = wJalrXUtnFEMI/K7MDENG/bPxRfiCYEXAMPLEKEY中的
我们用的是本地的minIO作为图像生成的存储服务。当然用阿里云的OSS应该也是没有问题的。
通过以上的配置,当Grafana监测到系统指标超过告警阀值,则就会向钉钉发送图文消息