[I]Data Structure
1.vector
- numeric
> a<-c(1,2,3)
> a
[1] 1 2 3- character
> a<-c("1","2","3")
> a
[1] "1" "2" "3"- logicals
> a<-c(FALSE,TRUE)
> a
[1] FALSE TRUE- scalar
> a<-FALSE
> a
[1] FALSE
2.matrix
- create
#base
> mymatrix<-matrix(1:9,nrow=3,ncol=3)
> mymatrix
     [,1] [,2] [,3]
[1,]    1    4    7
[2,]    2    5    8
[3,]    3    6    9
#labeling rows/cols
> cells<-c(1:9)
> rnames<-c("R1","R2","R3")
> cnames<-c("C1","C2","C3")
> mymatrix<-matrix(cells,nrow=3,ncol=3,byrow=TRUE,dimnames=list(rnames,cnames)) #fill according to row
> mymatrix
C1 C2 C3
R1 1 2 3
R2 4 5 6
R3 7 8 9
> mymatrix<-matrix(cells,nrow=3,ncol=3,byrow=FALSE,dimnames=list(rnames,cnames)) #fill according to column
> mymatrix
C1 C2 C3
R1 1 4 7
R2 2 5 8
R3 3 6 9- index
> mymatrix[2,]
C1 C2 C3
 2  5  8
> mymatrix[,2]
R1 R2 R3
 4  5  6
> mymatrix[2,2]
[1] 5
> mymatrix[2,c(1,2)]
C1 C2
 2  5
3.array
> dim1<-c("A1","A2","A3")
> dim2<-c("B1","B2","B3")
> dim3<-c("C1","C2","C3")
> myarry<-array(1:27,c(3,3,3),dimnames=list(dim1,dim2,dim3))
> myarray
, , C1

   B1 B2 B3
A1  1  4  7
A2  2  5  8
A3  3  6  9

, , C2

   B1 B2 B3
A1 10 13 16
A2 11 14 17
A3 12 15 18

, , C3

   B1 B2 B3
A1 19 22 25
A2 20 23 26
A3 21 24 27
4.data frame
- create
> ID<-c(1,2,3,4)
> age<-c(27,26,32,54)
> sex<-c("Male","Female","Female","Female")
> music<-c("Type2","Type1","Type1","Type1")
> status<-c("Excellent","Improved","Poor","Excellent")
> singerdata<-data.frame(ID,age,sex,music,status)
> singerdata
  ID age    sex music    status
1  1  27   Male Type1 Excellent
2  2  26 Female Type2  Improved
3  3  32 Female Type1      Poor
4 4 54 Female Type1 Excellent- select
#base
> singerdata[1:2]
  ID age
1  1  27
2  2  26
3  3  32
4  4  54
> singerdata[c("music","status")]
  music    status
1 Type2 Excellent
2 Type1  Improved
3 Type1      Poor
4 Type1 Excellent
> table(singerdata$music,singerdata$status)

        Excellent Improved Poor
  Type1         1        1    1
  Type2         1        0    0
#external data:e.g.mtcars
> attach(mtcars) #No object of the same name
> summary(mpg)
Min. 1st Qu. Median Mean 3rd Qu. Max.
10.40 15.43 19.20 20.09 22.80 33.90
> plot(mpg,disp)
> detach(mtcars)
> with(mtcars,{ #object of the same name
+ nokeepstats<-summary(mpg)
+ keepstats<<-summary(mpg)
+ })
> nokeepstats #internal call
Error: object 'nokeepstats' not found
> keepstats #external call
Min. 1st Qu. Median Mean 3rd Qu. Max.
10.40 15.43 19.20 20.09 22.80 33.90
5.factor
> ID<-c(1,2,3,4)
> age<-c(27,26,32,54)
> sex<-c(1,2,2,2)
> music<-c("Type1","Type2","Type1","Type1")
> status<-c("Excellent","Improved","Poor","Excellent")
> sex<-factor(sex,levels=c(1,2),labels=c("Male","Female"))    #label replace
> music<-factor(music)    #default order:A-Z
> status<-factor(status,order=TRUE,levels=c("Poor","Improved","Excellent"))    #customize order
> singerdata<-data.frame(ID,age,sex,music,status)
> str(singerdata)
'data.frame':   4 obs. of  5 variables:
 $ ID    : num  1 2 3 4
 $ age   : num  27 26 32 54
 $ sex   : Factor w/ 2 levels "Male","Female": 1 2 2 2
 $ music : Factor w/ 2 levels "Type1","Type2": 1 2 1 1
 $ status: Ord.factor w/ 3 levels "Poor"<"Improved"<..: 3 2 1 3
> summary(singerdata)
       ID            age            sex      music         status
 Min.   :1.00   Min.   :26.00   Male  :1   Type1:3   Poor     :1
 1st Qu.:1.75   1st Qu.:26.75   Female:3   Type2:1   Improved :1
 Median :2.50   Median :29.50                        Excellent:2
 Mean   :2.50   Mean   :34.75
 3rd Qu.:3.25   3rd Qu.:37.50
 Max.   :4.00   Max.   :54.00
6.list
- create
> tit<-"singer list"
> name<-c("Hua","Deng","Ga","Wang")
> age<-c(27,26,32,54)
> position<-matrix(1:9,nrow=3)
> mylist<-list(title=tit,name,ages=age,position)
> mylist
$title
[1] "singer list"

[[2]]
[1] "Hua"  "Deng" "Ga"   "Wang"

$ages
[1] 27 26 32 54

[[4]]
     [,1] [,2] [,3]
[1,]    1    4    7
[2,]    2    5    8
[3,] 3 6 9- index
> mylist[[2]]
[1] "Hua"  "Deng" "Ga"   "Wang"
> mylist[["ages"]]
[1] 27 26 32 54
[II]Import Data
1.keyboard
- text editor
> mydata<-data.frame(age=numeric(0),sex=character(0),order=numeric(0))
> mydata<-edit(mydata)    #reopen:> mydata<-edit(mydata)
result:
- embedded
> mydatatxt<-"
+ age sex order
+ 27 Male 1
+ 26 Female 2
+ 32 Female 3
+ 54 Female 4
+ "
> mydata<-read.table(header=TRUE,text=mydatatxt)
> mydata
  age    sex order
1  27   Male     1
2  26 Female     2
3  32 Female     3
4  54 Female     4
2.delimited text file
singerdata.csv
> music<-read.table("singerdata.csv",header=TRUE,row.names="ID",sep=",",colClasses=c("character","character","numeric","character","numeric"))
> music
  name age    sex music
1  Hua  27   Male   100
2 Deng  26 Female    95
3   Ga  32 Female    NA
4 Wang  54 Female    93
> str(music)
'data.frame':   4 obs. of  4 variables:
 $ name : chr  "Hua" "Deng" "Ga" "Wang"
 $ age  : num  27 26 32 54
 $ sex  : chr  "Male" "Female" "Female" "Female"
 $ music: num  100 95 NA 93
3.Excel
> install.packages("xlsx")
> install.packages("xlsxjars")
> install.packages("rJava")
> library(xlsx)
> workbook<-"c:/myworkbook.xlsx"
> mydatdaframe<-read.xls(workbook,1)
4.XML
5.web page
Webscraping using readLines and RCurl
6.SPSS
> install.packages("Hmisc")
> library(Hmisc)
> mydataframe<-spss.get("mydata.sav",use.value.labels=TRUE)
7.SAS
#installed SAS
> install.packages("Hmisc")
> library(Hmisc)
> datadir<-"C/data"
> sasexe<-"C/Program Files/SASHome/SASFoundation/9.4/sas.exe"
> mydata<-sas.get(libraryName=datadir,member="clients",sasprog=sasexe)
#not installed SAS
> install.packages("sas7bdat")
> library(sas7bdat)
> mydata<-read.sas7bdat("C:/mydata/clients.sas7bdat")8.Stata
> install.packages("foreign")
> library(foreign)
> mydataframe<-read.dta("mydata.dta")
9.NetCDF
> install.packages("ncdf4")
> library(ncdf4)
> myarray<-ncatt_get(nc,varid)
10.HDF5
> source("http://bioconductor.org/biocLite.R")
> biocLite("rhdf5")
> library(rhdf5)
> h5ls("C:/mydata")
11.data management system
- ODBC API
> install.packages("RODBC")
> library(RODBC)
> myconn<-odbcConnect("mydsn",uid="xw",pwd="xinwenfan")
> crimedat<-sqlFetch(mymonn,Crime)
> pundat<-sqlQuery(myconn,"select* from Punishment")
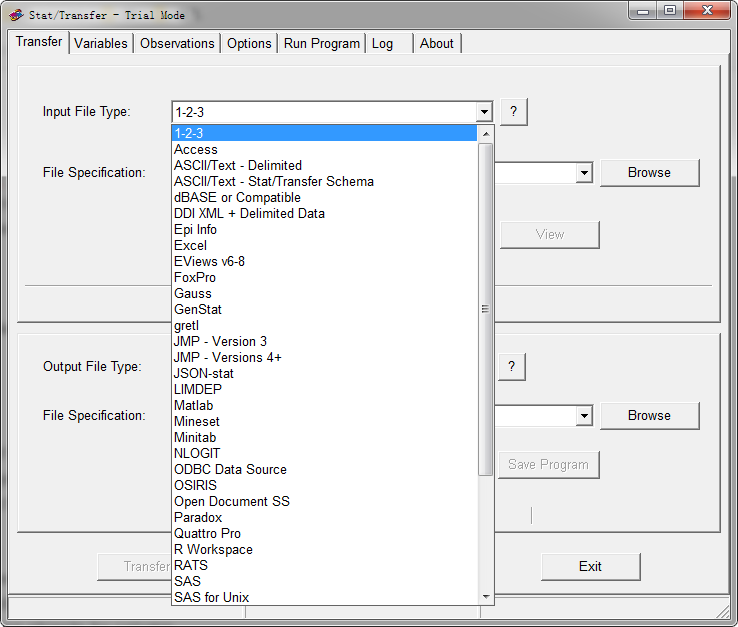
> close(myconn)12.Stat/Transfer

[III]Object Function
> length(object)    #the number of elements/ingredients in the object
> dim(object)    #dimension of object
> str(object)    #structure of object
> class(object)    #type of object
> mode(object)    #type of object
> names(object)    #name of ingredients
> c(object,object,...)    #binding objects into one vector
> cbind(object,object,...)    #binding objects by column
> rbind(object,)    #binding objects by row
> object    #printing object
> head(object)    #listing the beginning part
> tail(object)    #listing the ending part
> ls()    #show current list
----
[IV]Generate dynamic reports by R and LaTex
1.install LeTex
Linux:TeXLive
Windows:MikTex
Mac:MacTeX
2.install knitr
> install.packages("knitr")3.install data package
#e.g.multcomp
> install.packages("multcomp")
4.Creat File.Rnw
#e.g. drugs.Rnw
5.process data
> library(knitr)
> knit("drugs.Rnw")    #drugs.tex
> knit2pdf("drugs.Rnw")    #drugs.pdf
END!


