
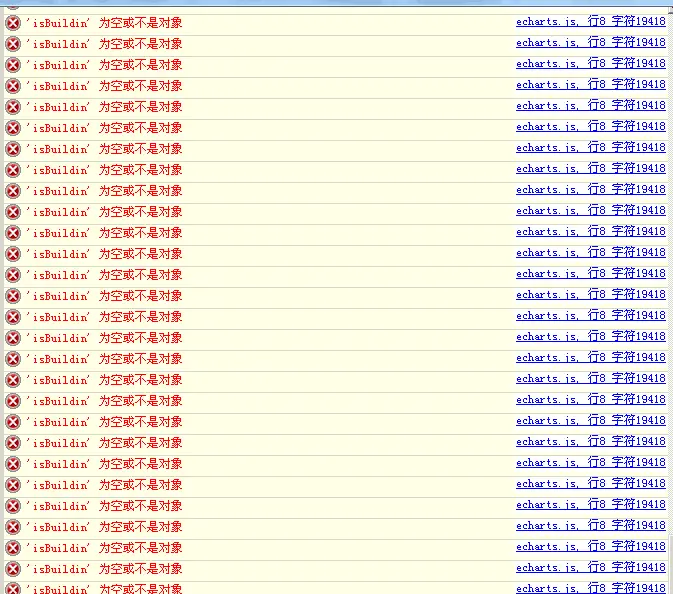
一直刷新这个 页面展现也没有问题 但是这样会导致浏览器崩溃 消耗大量内存
版权声明:本文内容由阿里云实名注册用户自发贡献,版权归原作者所有,阿里云开发者社区不拥有其著作权,亦不承担相应法律责任。具体规则请查看《阿里云开发者社区用户服务协议》和《阿里云开发者社区知识产权保护指引》。如果您发现本社区中有涉嫌抄袭的内容,填写侵权投诉表单进行举报,一经查实,本社区将立刻删除涉嫌侵权内容。
关键的代码贴出来分析下你好,我已经把代码贴到评论贴里面了,帮我分下下,看是不是代码的问题?这个是更新数据的代码:
chartsOption.series[0].data= dataList!=""?dataList:[];//数据当前值
chartsOption.series[0].name= kpiName!=""?kpiName:[];
chartsOption.xAxis[0].data=timeList!=""?timeList:[];//x轴刻度
//chartsOption.title.text=kpiName;
//option.tooltip.formatter=kpiName;//x轴
//chartsOption.legend.data[0]=[""+kpiName+""];
//非入口或再次使用,图表已被加载注册
require('echarts').init(document.getElementById(chart_id)).setOption(chartsOption,true);
这个是配置项
varchartsOption={
tooltip:{
trigger:'axis',
/formatter:"<table><tr><tdcolspan='4'align='left'><fontcolor='#FE6F18'size='2'><b>{a}</b></font><fontcolor='#474747'size='2'>({b})</font></td></tr>"+
"<tr><tdalign='left'><fontcolor='#474747'size='2'>当前值:</font></td><tdalign='right'><fontcolor='#474747'size='2'><b>{c}</b></font></p><td><tdcolspan='2'></td></tr>"+
"<tr><tdalign='left'><fontcolor='#474747'size='2'>同比:</font></td><tdalign='right'><fontcolor='#FE6F18'size='2'><b>{c1}</b></font></td>"+
"<tdalign='left'><fontcolor='#474747'size='2'>环比:</font></td><tdalign='right'><fontcolor='#FE6F18'size='2'><b>{c2}</b></font></td></tr>"+
"</table>",/
borderColor:"#A4CFFF",
borderWidth:"1",
padding:'10',
formatter:function(params,ticket,callback){
//setTimeout(function(){callback(ticket,reqTrendDataTip(params[0].name));},10);
//return'loading';
returnreqTrendDataTip(params[0].name);
},
backgroundColor:'rgba(230,242,255,0.88)'
},
calculable:false,
animation:false,
legend:{
data:[],
show:false,
padding:0,
itemGap:0/,
selectedMode:'multiple'/
},
toolbox:{
show:true,
feature:{
mark:{show:false},
dataZoom:{show:true},
dataView:{show:false},
magicType:{show:true,type:['line','bar']},
restore:{show:true},
saveAsImage:{show:true}
},
orient:'vertical',
x:'right',
y:'top'
},
dataZoom:{
show:true,
realtime:true,
start:20,
end:80,
height:15,
handleColor:'rgba(161,205,239,1)',
fillerColor:'rgba(228,240,247,1)',
backgroundColor:'rgba(243,243,243,1)'
},
xAxis:[
{
type:'category',
show:true,
boundaryGap:false,
axisLabel:{
//rotate:45,
textStyle:{
fontWeight:100,
fontStyle:'normal',
fontSize:11,
fontFamily:'微软雅黑,Arial,Verdana,sans-serif',
align:'center'
}//,
//interval:15
},
axisLine:{//坐标轴
show:false
},
data:[],//x轴坐标数据
splitLine:{
show:false
},
axisTick:{
show:false
}
}
],
yAxis:[
{
type:'value',
show:false
}
],
series:[
{
name:'',//标题
type:'line',
symbol:"emptyCircle",
smooth:true,
data:[],//数据
itemStyle:{
normal:{
color:'#1E97D2',
lineStyle:{
color:'#1E97D2'
}
}
}
}
],
grid:{
x:40,
//y:35,
y:0,
x2:42,
y2:45,
borderWidth:0
},
title:{
text:'',
x:'center',
show:false
}
};
看下我的代码有问题么?
