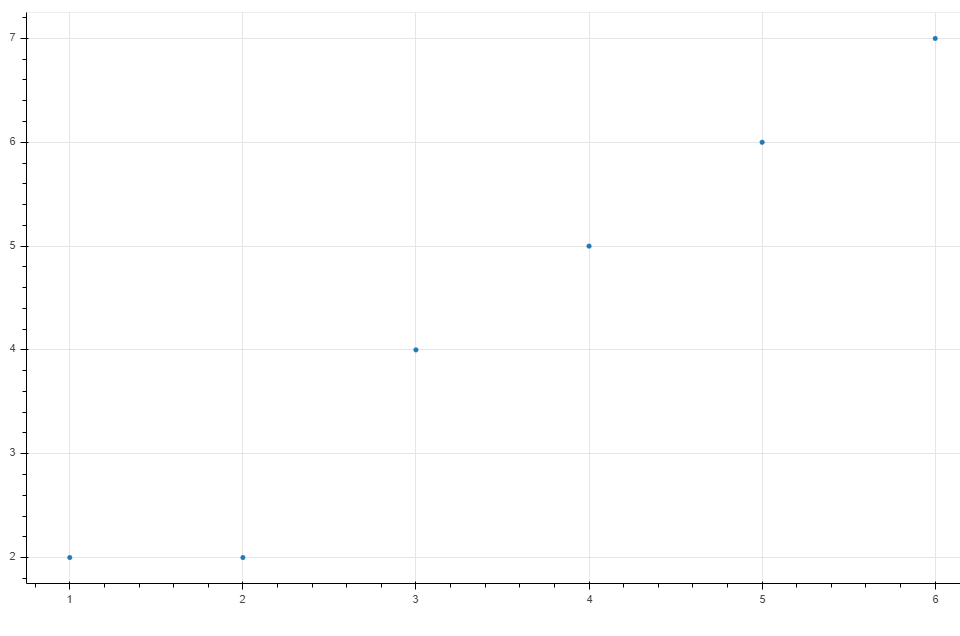
我试过以下,但颜色仍然是蓝色。
from bokeh.plotting import figure, show, output_file, ColumnDataSource
TOOLS="hover,crosshair,pan,wheel_zoom,zoom_in,zoom_out,box_zoom,undo,redo,reset,tap,save,box_select,poly_select,lasso_select,"
source = ColumnDataSource(data=dict(
    x=[1,2,3,4,5,6],
    y=[2,2,4,5,6,7],
    desc=['type1', 'type1', 'type2','type2','type1','type1'],
    fill_color=['green','grey','grey','red','red','red'],
    #fill_alpha=0.6,
    #line_color=None
))
TOOLTIPS = [
    ("index", "$index"),
    ("(x,y)", "($x, $y)"),
    ("desc", "@desc"),
    ("fill_color", "@fill_color")]
p = figure(tools=TOOLS, plot_width=1000, tooltips=TOOLTIPS)
p.scatter(x='x',y='y', source=source)
output_file("color_scatter.html", title="color_scatter.py example")
show(p) # open a browser
如何在散景图上散布标签和独特颜色?
版权声明:本文内容由阿里云实名注册用户自发贡献,版权归原作者所有,阿里云开发者社区不拥有其著作权,亦不承担相应法律责任。具体规则请查看《阿里云开发者社区用户服务协议》和《阿里云开发者社区知识产权保护指引》。如果您发现本社区中有涉嫌抄袭的内容,填写侵权投诉表单进行举报,一经查实,本社区将立刻删除涉嫌侵权内容。
您尚未告知scatter使用数据源中的颜色数据:
p.scatter(x='x', y='y', fill_color='fill_color', source=source)