画XY坐标轴
坐标轴本质上就是两条直线,所以第一步确定坐标原点,然后以坐标原点画出垂直和水平的两条直线。我们设置坐标原点离画布的左内边距和底部内边距,这样我们可以通过画布的高度减去底部内边距得到 原点的y, 然后通过画布的宽度减去左内边距得到x, 有了坐标原点画坐标轴就没什么大问题了。代码如下:
//定义坐标轴相对于画布的内边距
  this.paddingLeft = 30 // 至少大于绘制文字的宽度
  this.paddingBottom = 30 // 至少大于绘制文字的高度
  this.origin = new Point2d(
    this.paddingLeft,
    this.height - this.paddingBottom
  )
  this.drawCircle(this.origin, 1, 'red')
  this.addxAxis()
  this.addyAxis()
  // 画 x 轴
  addxAxis() {
    const end = this.origin
      .clone()
      .add(new Point2d(this.width - this.paddingLeft * 2, 0))
    this.drawLine(this.origin, end)
  }
  // 画y轴
  addyAxis() {
    const end = this.origin
      .clone()
      .sub(new Point2d(0, this.height - this.paddingBottom * 2))
    this.drawLine(this.origin, end)
  }
「这里要特别提示的是 首先整个画布的 坐标轴 是在整个屏幕的左上方, 但是我们显示的坐标原点是在 左下方, 然后 画Y轴的时候是由原点向上减去, 是向量点的减法。」
效果图如下 :
image-20210710165738306.png
但是和echarts 那个不太一样, 他的x轴是有线段的和文字的,接下来我们就开始改造 x轴。就是将X轴分几段嘛,
然后生成一个点的集合,这些点的y都是相同的, 然后 x是不相同的。代码如下:
drawLineWithDiscrete(start, end, n = 5) {
    // 由于 x 轴上的 y 都是相同的
    const points = []
    const startX = start.x
    const endX = end.x
    points.push(start)
    const segmentValue = (endX - startX) / n
    for (let i = 1; i <= n - 1; i++) {
      points.push(new Point2d(startX + i * segmentValue, start.y))
    }
    points.push(end)
    // 生成线段
    points.forEach((point) => {
      this.drawLine(point, point.clone().add(new Point2d(0, 5)))
    })
  }
这里要注意的就是循环的个数,因为起始点和终止点是有的。看下效果图:
这时候还差文字,canvas 绘制文字的api
在指定的(x,y)位置填充指定的文本,绘制的最大宽度是可选的.
ctx.fillText(text,x,y,[,maxwidth])
所以说白了还是去计算文字点的坐标,首先在项目初始化的定义X轴和Y轴的数据。代码如下:
this.axisData = ['Mon', 'Tue', 'Wed', 'Thu', 'Fri', 'Sat', 'Sun']
 this.yxisData = ['0', '50', '100', '150', '200', '250', '300']
文字我们统一放在线段的中点处其实只要计算每个分段数的长度然后在端点处+分段数长度的一半就可以得到。代码如下:
// 生成X轴文字的点
const segmentValue = (endX - startX) / n
for (let i = 0; i <= n - 1; i++) {
  const textpoint = new Point2d(
    startX + i * segmentValue + segmentValue / 2,
    start.y + 20
  )
  // 这里每个点的文字与X轴数据是互相呼应的
  textPoints.push({
    point: textpoint,
    text: this.axisData[i],
  })
}
// 生成文字
this.clearFillColor()
textPoints.forEach((info) => {
  const { text, point } = info
  this.ctx.fillText(text, point.x, point.y)
})
效果图如下:
x轴文字
但是看着图好像文字并没有处于居中的位置, 胖虎思考了🤔一下, 其实因为文字也有长度, 所以每一个文字的坐标要减去文字长度的一半值就对了。这时候this.ctx.fillText 的第三个参数就显得十分重要了, 限制文字的长度, 这样我们就可以处理了, 代码 重新修改下:
// 限制文字的长度
this.ctx.fillText(text, point.x, point.y, 20)
// 文字的每个点要减去长度的一半
const textpoint = new Point2d(
  startX + i * segmentValue + segmentValue / 2 - 10,
  start.y + 20
)
直接看效果图:
x轴
这下看一下就是完美。
X轴的处理好了,我们处理Y轴,Y轴其实相对比较简单就是每个数据对应的一条直线。
Y轴的话也是要计算每个线段的长度的值,然后画出直线, 这里要特别注意的是就是文字的放置, 在每个端点还要进行微调。使得文字和直线居中对齐。代码如下:
addyAxis() {
  const end = this.origin
    .clone()
    .sub(new Point2d(0, this.height - this.paddingBottom * 2))
  const points = []
  const length = this.origin.y - end.y
  const segmentValue = length / this.yxisData.length
  for (let i = 0; i < this.yxisData.length; i++) {
    const point = new Point2d(end.x, this.origin.y - i * segmentValue)
    points.push({
      point,
      text: this.yxisData[i],
    })
  }
  points.forEach((info) => {
    const { text, point } = info
    const end = point
      .clone()
      .add(new Point2d(this.width - this.paddingLeft * 2, 0))
    this.setStrokeColor('#E0E6F1')
    this.drawLine(point, end)
    this.clearStrokeColor()
    this.ctx.fillText(text, point.clone().x - 30, point.y + 4, 20)
  })
}
因为过程和X轴十分相似, 提醒一下描边 设置后,要将它恢复默认,不然会引用上一个颜色哦。
如图:
坐标轴
整个画布就差最后一步了, 生成折线图, 我们在上面已经封装了,带圆的直线, 所以只要找到所有的点去画折线图就好了。首先每个点的X坐标没什么问题对应的就是每个「文字的中点」, 主要是「Y轴的坐标」:回忆一下之前我们是怎么去计算Y轴的坐标的是, 长度/ 除以分段数 去计算的。「这样就导致一个问题,出来的结果可能是一个小数,因为我们实际的数据 可能是223 这种这样导致画出来的图形点误差太大, 所以为了减少误差, 我换一个计算模式,就是进行等分,这样在区间里面的点都可以表达, 误差可以稍微小点, 其实在实际项目中, 容差问题是计算肯定存在的问题,js 本身就有0.1+0.2 这样的问题, 所以或者说在容差范围内我们可以认为这两个点是等价的」 代码如下:
const length = this.origin.y - end.y
const division = length / 300
const point = new Point2d(end.x, this.origin.y - i * division * 50)
然后我这时候引入真实的数据:
this.realData = [150, 230, 224, 218, 135, 147, 260]
this.xPoints = []
this.yPoints = []
分别对应的是真实的数据, xPoints是什么文字的中点坐标代码如下:
// 生成文字
this.clearFillColor()
textPoints.forEach((info) => {
  const { text, point } = info
  this.xPoints.push(point.x)
  this.ctx.fillText(text, point.x, point.y, 20)
})
yPoints其实也就比较简单了, 真实数据 * 每一份的距离就好了。
const division = length / 300
for (let i = 0; i < this.yxisData.length; i++) {
  const point = new Point2d(end.x, this.origin.y - i * division * 50)
  // 在这里, 还是得注意坐标轴的位置
  const realData = this.realData[i]
  this.yPoints.push(this.origin.y - realData * division)
  points.push({
    point,
    text: this.yxisData[i],
  })
}
数据准备好了,我们就开始调用方法去画折线图:
let start = new Point2d(this.xPoints[0], this.yPoints[0])
// 生成折线图
this.setStrokeColor('#5370C6')
this.xPoints.slice(1).forEach((x, index) => {
  const end = new Point2d(x, this.yPoints[index + 1])
  this.drawLineWithCircle(start, end)
  start = end
})
这段代码需要注意的是默认找一个开始点, 然后 不断地去更改开始点, 然后注意下标位置。
如图:
点重复
目前存在的问题:
- 存在的圆点重复
- 圆点的半径大小不一致,说明我们之前计算圆心到直线的距离 这样设为 半径是错误的, 因为每条的线的斜率是不一样的。所以算出来是有问题的。
到这里打大家可以这么去思考,为什么圆和直线要捆绑在一起? 单独画不就没有这样的问题了。说干就干,
let start = new Point2d(this.xPoints[0], this.yPoints[0])
this.drawCircle(start)
// 生成折线图
this.setStrokeColor('#5370C6')
this.xPoints.slice(1).forEach((x, index) => {
  const end = new Point2d(x, this.yPoints[index + 1])
  // 画圆
  this.drawCircle(end)
  // 画直线
  this.drawLine(start, end)
  start = end
})
这里注意会少一个开始圆,我们在开头的直接补上就好了, 圆的半径我都统一设置了。
如图:
最终折线图
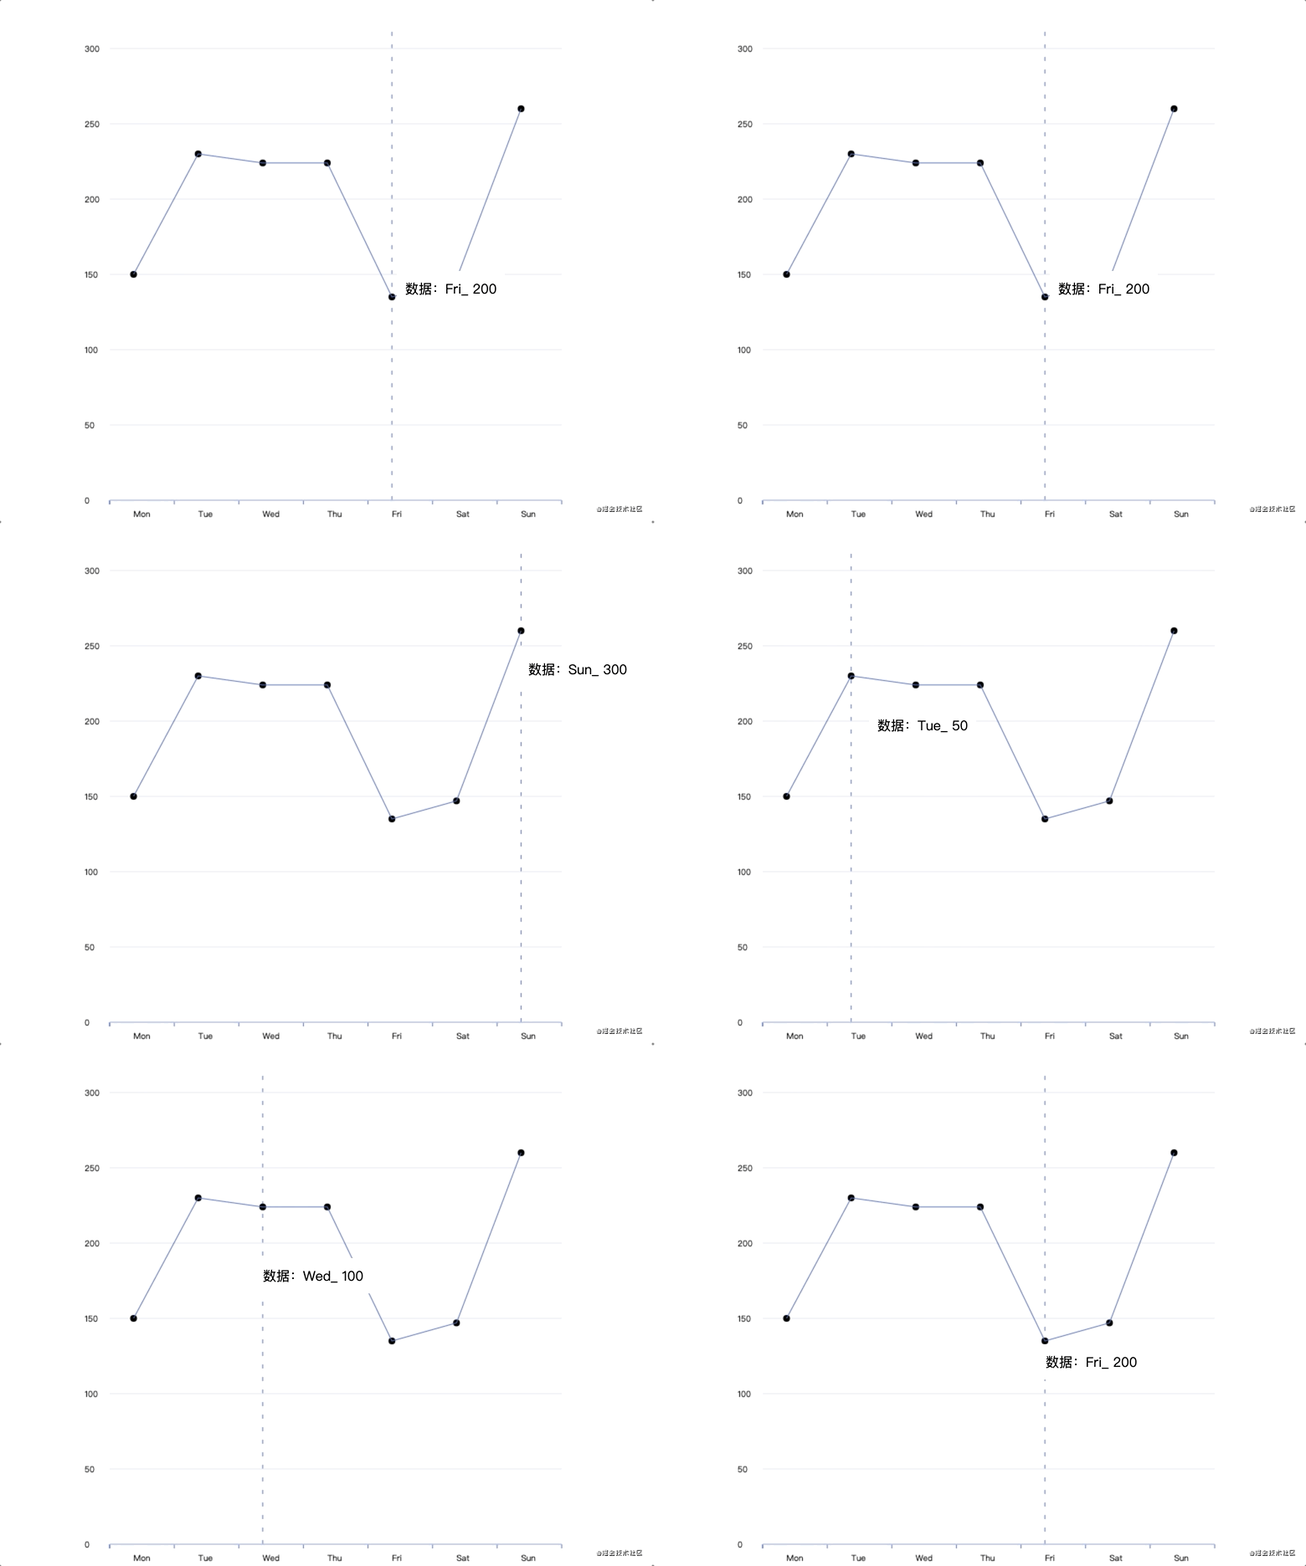
至此到这里, 这折线图全部完成,为了做的更完美一点,我还是增加的提示和虚线。
显示tooltip
这里我看大多数图表都在鼠标移动的时候都会显示一个虚线和提示,不然我怎么清除的看数据对吧。我们还是初始化一个div将它的样式设置为隐藏。
#tooltip {
  position: absolute;
  z-index: 2;
  background: white;
  padding: 10px;
  border-radius: 2px;
  visibility: hidden;
}
<div id="tooltip"></div>
为canvas 增加监听事件:
canvas.addEventListener('mousemove', this.onMouseMove.bind(this))
// 这里取相对于画布原点的位置 offset
onMouseMove(e) {
  const x = e.offsetX
  const y = e.offsetY
}
其实我们要做的事情非常简单首先我们就是去比较鼠标的点 和 实际的点在某个范围内我就显示,类似于吸附, 从用户的角度不可能完全移动到那里才显示。
代码如下:
onMouseMove(e) {
  const x = e.offsetX
  const find = this.xPoints.findIndex(
    (item) => Math.abs(x - item) <= this.tolerance
  )
  if (find > -1) {
    this.tooltip.textContent = `数据:${this.axisData[find]}_ ${this.yxisData[find]}`
    this.tooltip.style.visibility = 'visible'
    this.tooltip.style.left = e.clientX + 2 + 'px'
    this.tooltip.style.top = e.clientY + 2 + 'px'
  } else {
    this.tooltip.style.visibility = 'hidden'
  }
}
这里其实只要比较x的位置就好了,容差可以自定义设置。
画垂直的虚线
我看了很多图表他们都有垂直的虚线,这里就涉及到一个问题canvas 如何画虚线, 我在用canvas 实现矩形的移动(点、线、面)(1)这篇文章有介绍, 我就直接拿过来,不过多解释了,感兴趣的小伙伴可以看下这篇文章。代码如下:
drawDashLine(start, end) {
  if (!start || !end) {
    return
  }
  this.ctx.setLineDash([5, 10])
  this.beginPath()
  this.moveTo(start.x, start.y)
  this.lineTo(end.x, end.y)
  ctx.stroke()
}
我们对onMouseMove 再一次进行改造:
onMouseMove(e) {
  const x = e.offsetX
  const find = this.xPoints.findIndex(
    (item) => Math.abs(x - item) <= this.tolerance
  )
  if (find > -1) {
    this.tooltip.textContent = `数据:${this.axisData[find]}_ ${this.yxisData[find]}`
    this.tooltip.style.visibility = 'visible'
    this.tooltip.style.left = e.clientX + 2 + 'px'
    this.tooltip.style.top = e.clientY + 2 + 'px'
    // 画虚线
    const start = new Point2d(this.xPoints[find], this.origin.y)
    const end = new Point2d(this.xPoints[find], 0)
    this.drawDashLine(start, end)
  } else {
    this.tooltip.style.visibility = 'hidden'
  }
}
增加了以下代码, 但是这样是有问题的,就是我们鼠标不停的移动, 所以上一次绘制的虚线不会取消。会出现下面这种情况:
虚线图
所以我做了一个数据清除同时清除画布上的东西重新画:
clearData() {
  this.ctx.clearRect(0, 0, 600, 600)
  this.xPoints = []
  this.yPoints = []
}
整体代码如下:
const start = new Point2d(this.xPoints[find], this.origin.y)
const end = new Point2d(this.xPoints[find], 0)
// 清除数据
this.clearData()
this.drawDashLine(start, end)
// 虚线样式也要每次清除 不然会影响下面的画的样式
this.ctx.setLineDash([])
this.addxAxis()
this.addyAxis()
this.setStrokeColor('#5370C6')
this.generateLineChart()
restore和save的妙用
再给出一个小技巧**, 其实canvas 中 画图如果某次的样只想在某一个绘制中起作用:有save 和 restore方法
使用 save() 方法保存当前的状态,使用 restore() 进行恢复成一开始的样子
所以我们可以重新改写下画虚线的方法,在一开始的时候svae 一下, 然后结束在 restore , 有点像栈的感觉,先进去,然后画结束,弹出来。每一项都有自己的独特的画图状态,不影响其他项。
drawDashLine(start, end) {
    if (!start || !end) {
      return
    }
    this.ctx.save()
    this.ctx.setLineDash([5, 10])
    this.beginPath()
    this.moveTo(start.x, start.y)
    this.lineTo(end.x, end.y)
    this.stroke()
    this.ctx.restore()
  }
至此整个折线图我想给大家讲解的已经结束了,我们看下效果吧:
折线图最终结果.gif


