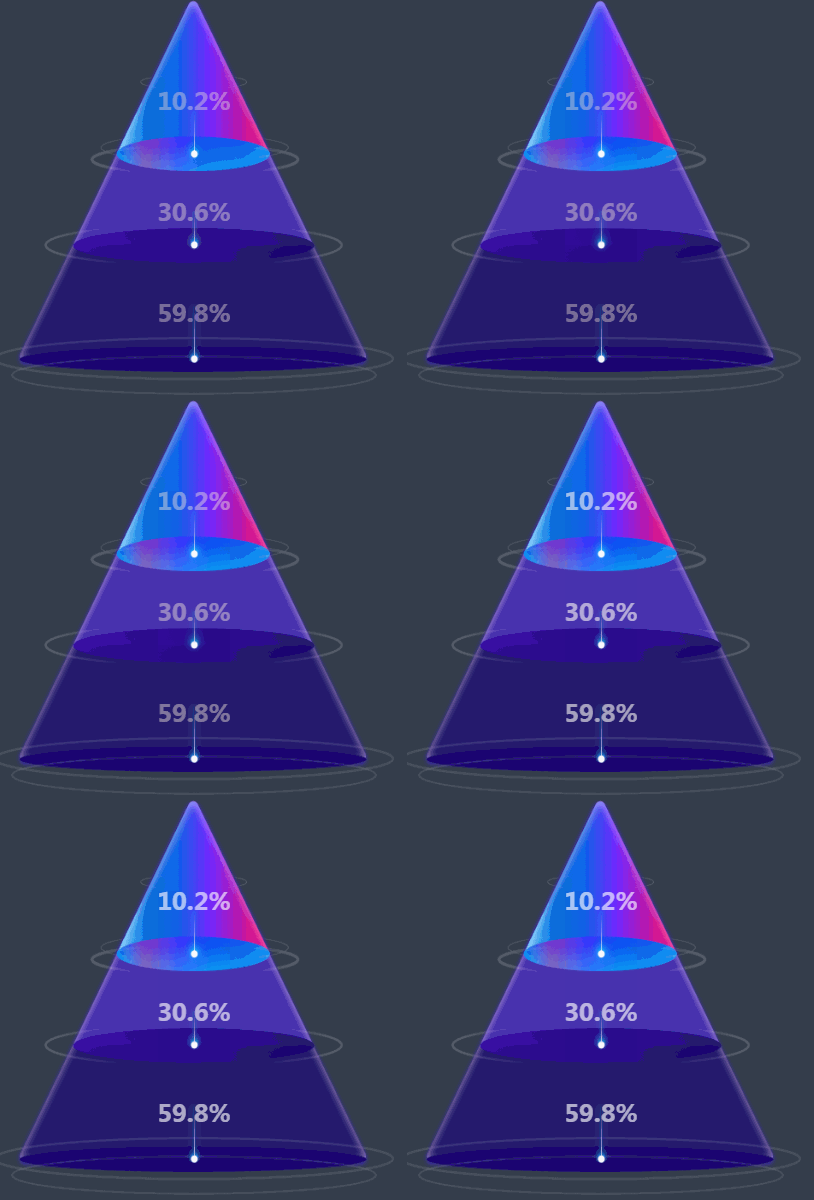
Echarts的Funnel目前是不支持3D的,但是设计师在项目过程中,为了项目的炫目,会出现伪3D之类的图表。本案例是基于HTML+CSS的解决方案
CSS样式表
       body {
            margin: 0;
            padding: 0;
            background-color: #343d4b;
        }
        .funnel {
            background: url("funnel.png") no-repeat top center;
            background-size: 100% 100%;
            width: 400px;
            height: 400px;
            text-align: center;
        }
        .f1, .f2, .f3 {
            color: rgba(255, 255, 255, 0.8);
            font-weight: bold;
            font-size: 24px;
            animation: shake 2.2s infinite;
        }
        .f1 {
            padding-top: 90px;
        }
        .f2 {
            padding-top: 80px;
        }
        .f3 {
            padding-top: 70px;
        }
        @-webkit-keyframes shake {
            0% {
                opacity: 0.8;
                color: #5151E5;
            }
            50% {
                opacity: 0.4;
                color: antiquewhite;
            }
            100% {
                opacity: 0.8;
            }
        }
HTML代码
<div class="funnel">
    <div class="f1">10.2%</div>
    <div class="f2">30.6%</div>
    <div class="f3">59.8%</div>
</div>
Done!


