Matplotlib 作为 Python 家族当中最为著名的画图工具,基本的操作还是要掌握的,今天就来分享一波
文章很长,高低要忍一下,如果忍不了,那就收藏吧,总会用到的
萝卜哥也贴心的做成了PDF,在文末获取!
- 启用和检查交互模式
- 在 Matplotlib 中绘制折线图
- 绘制带有标签和图例的多条线的折线图
- 在 Matplotlib 中绘制带有标记的折线图
- 改变 Matplotlib 中绘制的图形的大小
- 在 Matplotlib 中设置轴限制
- 使用 Python Matplotlib 显示背景网格
- 使用 Python Matplotlib 将绘图保存到图像文件
- 将图例放在 plot 的不同位置
- 绘制具有不同标记大小的线条
- 用灰度线绘制折线图
- 以高 dpi 绘制 PDF 输出
- 绘制不同颜色的多线图
- 语料库创建词云
- 使用特定颜色在 Matplotlib Python 中绘制图形
- NLTK 词汇色散图
- 绘制具有不同线条图案的折线图
- 更新 Matplotlib 折线图中的字体外观
- 用颜色名称绘制虚线和点状图
- 以随机坐标绘制所有可用标记
- 绘制一个非常简单的条形图
- 在 X 轴上绘制带有组数据的条形图
- 具有不同颜色条形的条形图
- 使用 Matplotlib 中的特定值改变条形图中每个条的颜色
- 在 Matplotlib 中绘制散点图
- 使用单个标签绘制散点图
- 用标记大小绘制散点图
- 在散点图中调整标记大小和颜色
- 在 Matplotlib 中应用样式表
- 自定义网格颜色和样式
- 在 Python Matplotlib 中绘制饼图
- 在 Matplotlib 饼图中为楔形设置边框
- 在 Python Matplotlib 中设置饼图的方向
- 在 Matplotlib 中绘制具有不同颜色主题的饼图
- 在 Python Matplotlib 中打开饼图的轴
- 具有特定颜色和位置的饼图
- 在 Matplotlib 中绘制极坐标图
- 在 Matplotlib 中绘制半极坐标图
- Matplotlib 中的极坐标等值线图
- 绘制直方图
- 在 Matplotlib 直方图中选择 bins
- 在 Matplotlib 中绘制没有条形的直方图
- 使用 Matplotlib 同时绘制两个直方图
- 绘制具有特定颜色、边缘颜色和线宽的直方图
- 用颜色图绘制直方图
- 更改直方图上特定条的颜色
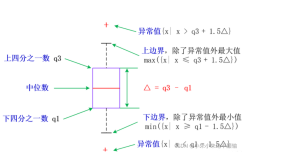
- 箱线图
- 箱型图按列数据分组
- 更改箱线图中的箱体颜色
- 更改 Boxplot 标记样式、标记颜色和标记大小
- 用数据系列绘制水平箱线图
- 箱线图调整底部和左侧
- 使用 Pandas 数据在 Matplotlib 中生成热图
- 带有中间颜色文本注释的热图
- 热图显示列和行的标签并以正确的方向显示数据
- 将 NA cells 与 HeatMap 中的其他 cells 区分开来
- 在 matplotlib 中创建径向热图
- 在 Matplotlib 中组合两个热图
- 使用 Numpy 和 Matplotlib 创建热图日历
- 在 Python 中创建分类气泡图
- 使用 Numpy 和 Matplotlib 创建方形气泡图
- 使用 Numpy 和 Matplotlib 创建具有气泡大小的图例
- 使用 Matplotlib 堆叠条形图
- 在同一图中绘制多个堆叠条
- Matplotlib 中的水平堆积条形图
1启用和检查交互模式
import matplotlib as mpl
import matplotlib.pyplot as plt
# Set the interactive mode to ON
plt.ion()
# Check the current status of interactive mode
print(mpl.is_interactive())
Output:
True
2在 Matplotlib 中绘制折线图
import matplotlib.pyplot as plt
#Plot a line graph
plt.plot([5, 15])
# Add labels and title
plt.title("Interactive Plot")
plt.xlabel("X-axis")
plt.ylabel("Y-axis")
plt.show()
Output:

3绘制带有标签和图例的多条线的折线图
import matplotlib.pyplot as plt
#Plot a line graph
plt.plot([5, 15], label='Rice')
plt.plot([3, 6], label='Oil')
plt.plot([8.0010, 14.2], label='Wheat')
plt.plot([1.95412, 6.98547, 5.41411, 5.99, 7.9999], label='Coffee')
# Add labels and title
plt.title("Interactive Plot")
plt.xlabel("X-axis")
plt.ylabel("Y-axis")
plt.legend()
plt.show()
Output:

4在 Matplotlib 中绘制带有标记的折线图
import matplotlib.pyplot as plt
# Changing default values for parameters individually
plt.rc('lines', linewidth=2, linestyle='-', marker='*')
plt.rcParams['lines.markersize'] = 25
plt.rcParams['font.size'] = '10.0'
#Plot a line graph
plt.plot([10, 20, 30, 40, 50])
# Add labels and title
plt.title("Interactive Plot")
plt.xlabel("X-axis")
plt.ylabel("Y-axis")
plt.show()
Output:

5改变 Matplotlib 中绘制的图形的大小
import matplotlib.pyplot as plt
# Changing default values for parameters individually
plt.rc('lines', linewidth=2, linestyle='-', marker='*')
plt.rcParams["figure.figsize"] = (4, 8)
# Plot a line graph
plt.plot([10, 20, 30, 40, 50, 60, 70, 80])
# Add labels and title
plt.title("Interactive Plot")
plt.xlabel("X-axis")
plt.ylabel("Y-axis")
plt.show()
Output:

6在 Matplotlib 中设置轴限制
import matplotlib.pyplot as plt
data1 = [11, 12, 13, 14, 15, 16, 17]
data2 = [15.5, 12.5, 11.7, 9.50, 12.50, 11.50, 14.75]
# Add labels and title
plt.title("Interactive Plot")
plt.xlabel("X-axis")
plt.ylabel("Y-axis")
# Set the limit for each axis
plt.xlim(11, 17)
plt.ylim(9, 16)
# Plot a line graph
plt.plot(data1, data2)
plt.show()
Output:

7使用 Python Matplotlib 显示背景网格
import matplotlib.pyplot as plt
plt.grid(True, linewidth=0.5, color='#ff0000', linestyle='-')
#Plot a line graph
plt.plot([10, 20, 30, 40, 50])
# Add labels and title
plt.title("Interactive Plot")
plt.xlabel("X-axis")
plt.ylabel("Y-axis")
plt.show()
Output:

8使用 Python Matplotlib 将绘图保存到图像文件
import matplotlib.pyplot as plt
plt.grid(True, linewidth=0.5, color='#ff0000', linestyle='-')
#Plot a line graph
plt.plot([10, 20, 30, 40, 50])
# Add labels and title
plt.title("Interactive Plot")
plt.xlabel("X-axis")
plt.ylabel("Y-axis")
plt.savefig("foo.png", bbox_inches='tight')
Output:

9将图例放在 plot 的不同位置
import matplotlib.pyplot as plt
#Plot a line graph
plt.plot([5, 15], label='Rice')
plt.plot([3, 6], label='Oil')
plt.plot([8.0010, 14.2], label='Wheat')
plt.plot([1.95412, 6.98547, 5.41411, 5.99, 7.9999], label='Coffee')
# Add labels and title
plt.title("Interactive Plot")
plt.xlabel("X-axis")
plt.ylabel("Y-axis")
plt.legend(bbox_to_anchor=(1.1, 1.05))
plt.show()
Output:

10绘制具有不同标记大小的线条
import matplotlib.pyplot as plt
y1 = [12, 14, 15, 18, 19, 13, 15, 16]
y2 = [22, 24, 25, 28, 29, 23, 25, 26]
y3 = [32, 34, 35, 38, 39, 33, 35, 36]
y4 = [42, 44, 45, 48, 49, 43, 45, 46]
y5 = [52, 54, 55, 58, 59, 53, 55, 56]
# Plot lines with different marker sizes
plt.plot(y1, y2, label = 'Y1-Y2', lw=2, marker='s', ms=10) # square
plt.plot(y1, y3, label = 'Y1-Y3', lw=2, marker='^', ms=10) # triangle
plt.plot(y1, y4, label = 'Y1-Y4', lw=2, marker='o', ms=10) # circle
plt.plot(y1, y5, label = 'Y1-Y5', lw=2, marker='D', ms=10) # diamond
plt.plot(y2, y5, label = 'Y2-Y5', lw=2, marker='P', ms=10) # filled plus sign
plt.legend()
plt.show()
Output:

11用灰度线绘制折线图
import matplotlib.pyplot as plt
# Plot a line graph with grayscale lines
plt.plot([5, 15], label='Rice', c='0.15')
plt.plot([3, 6], label='Oil', c='0.35')
plt.plot([8.0010, 14.2], label='Wheat',  c='0.55')
plt.plot([1.95412, 6.98547, 5.41411, 5.99, 7.9999], label='Coffee',  c='0.85')
# Add labels and title
plt.title("Interactive Plot")
plt.xlabel("X-axis")
plt.ylabel("Y-axis")
plt.legend()
plt.show()
Output:

12以高 dpi 绘制 PDF 输出
import matplotlib.pyplot as plt
#Plot a line graph
plt.plot([5, 15], label='Rice')
plt.plot([3, 6], label='Oil')
plt.plot([8.0010, 14.2], label='Wheat')
plt.plot([1.95412, 6.98547, 5.41411, 5.99, 7.9999], label='Coffee')
# Add labels and title
plt.title("Interactive Plot")
plt.xlabel("X-axis")
plt.ylabel("Y-axis")
plt.savefig('output.pdf', dpi=1200, format='pdf', bbox_inches='tight')
Output:
生成带有图片的pdf文件
13绘制不同颜色的多线图
import matplotlib.pyplot as plt
for i in range(10):
    plt.plot([i]*5, c='C'+str(i), label='C'+str(i))
# Plot a line graph
plt.xlim(0, 5)
# Add legend
plt.legend()
# Display the graph on the screen
plt.show()
Output:

14语料库创建词云
import nltk
from nltk.corpus import webtext
from nltk.probability import FreqDist
from wordcloud import WordCloud
import matplotlib.pyplot as plt
nltk.download('webtext')
wt_words = webtext.words('testing.txt')  # Sample data
data_analysis = nltk.FreqDist(wt_words)
filter_words = dict([(m, n) for m, n in data_analysis.items() if len(m) > 3])
wcloud = WordCloud().generate_from_frequencies(filter_words)
# Plotting the wordcloud
plt.imshow(wcloud, interpolation="bilinear")
plt.axis("off")
(-0.5, 399.5, 199.5, -0.5)
plt.show()
Output:

15使用特定颜色在 Matplotlib Python 中绘制图形
import matplotlib.pyplot as plt
#Plot a line graph with specific colors
plt.plot([5, 15], label='Rice', c='C7')
plt.plot([3, 6], label='Oil', c='C8')
plt.plot([8.0010, 14.2], label='Wheat',  c='C4')
plt.plot([1.95412, 6.98547, 5.41411, 5.99, 7.9999], label='Coffee',  c='C6')
# Add labels and title
plt.title("Interactive Plot")
plt.xlabel("X-axis")
plt.ylabel("Y-axis")
plt.legend()
plt.show()
Output

16NLTK 词汇色散图
import nltk
from nltk.corpus import webtext
from nltk.probability import FreqDist
from wordcloud import WordCloud
import matplotlib.pyplot as plt
words = ['data', 'science', 'dataset']
nltk.download('webtext')
wt_words = webtext.words('testing.txt')  # Sample data
points = [(x, y) for x in range(len(wt_words))
          for y in range(len(words)) if wt_words[x] == words[y]]
if points:
    x, y = zip(*points)
else:
    x = y = ()
plt.plot(x, y, "rx", scalex=.1)
plt.yticks(range(len(words)), words, color="b")
plt.ylim(-1, len(words))
plt.title("Lexical Dispersion Plot")
plt.xlabel("Word Offset")
plt.show()
Output:

17绘制具有不同线条图案的折线图
import matplotlib.pyplot as plt
# Plot a line graph with grayscale lines
plt.plot([5, 11], label='Rice', c='C1', ls='--')
plt.plot([2, 16], label='Oil', c='C4', ls='-.')
plt.plot([8, 14], label='Wheat', c='C7', ls=':')
# Add labels and title
plt.title("Interactive Plot")
plt.xlabel("X-axis")
plt.ylabel("Y-axis")
plt.legend()
plt.show()
Output:

18更新 Matplotlib 折线图中的字体外观
import matplotlib.pyplot as plt
fontparams = {'font.size': 12, 'font.weight':'bold',
              'font.family':'arial', 'font.style':'italic'}
plt.rcParams.update(fontparams)
# Plot a line graph with specific font style
plt.plot([5, 11], label='Rice')
plt.plot([2, 16], label='Oil')
plt.plot([8, 14], label='Wheat')
labelparams = {'size': 20, 'weight':'semibold',
              'family':'serif', 'style':'italic'}
# Add labels and title
plt.title("Interactive Plot", labelparams)
plt.xlabel("X-axis", labelparams)
plt.ylabel("Y-axis", labelparams)
plt.legend()
plt.show()
Output:

19用颜色名称绘制虚线和点状图
import matplotlib.pyplot as plt
x = [2, 4, 5, 8, 9, 13, 15, 16]
y = [1, 3, 4, 7, 10, 11, 14, 17]
# Plot a line graph with dashed and maroon color
plt.plot(x, y, label='Price', c='maroon', ls=('dashed'), lw=2)
# Plot a line graph with dotted and teal color
plt.plot(y, x, label='Rank', c='teal', ls=('dotted'), lw=2)
plt.legend()
plt.show()
Output:

20以随机坐标绘制所有可用标记
import numpy as np
import matplotlib.pyplot as plt
from matplotlib.lines import Line2D
# Prepare 50 random numbers to plot
n1 = np.random.rand(50)
n2 = np.random.rand(50)
markerindex = np.random.randint(0, len(Line2D.markers), 50)
for x, y in enumerate(Line2D.markers):
    i = (markerindex == x)
    plt.scatter(n1[i], n2[i], marker=y)
plt.show()
Output:

21绘制一个非常简单的条形图
import matplotlib.pyplot as plt
year = [2001, 2002, 2003, 2004, 2005, 2006]
unit = [50, 60, 75, 45, 70, 105]
# Plot the bar graph
plot = plt.bar(year, unit)
# Add the data value on head of the bar
for value in plot:
    height = value.get_height()
    plt.text(value.get_x() + value.get_width()/2.,
             1.002*height,'%d' % int(height), ha='center', va='bottom')
# Add labels and title
plt.title("Bar Chart")
plt.xlabel("Year")
plt.ylabel("Unit")
# Display the graph on the screen
plt.show()
Output:

22在 X 轴上绘制带有组数据的条形图
import pandas as pd
import matplotlib.pyplot as plt
df = pd.DataFrame([[1, 2, 3, 4], [7, 1.4, 2.1, 2.8], [5.5, 1.5, 8, 1.2],
                   [1.5, 1.4, 1, 8], [7, 1, 1, 8], [5, 4, 9, 2]],
                  columns=['Apple', 'Orange', 'Banana', 'Pear'],
                  index=[1, 7, 13, 20, 28, 35])
width = 2
bottom = 0
for i in df.columns:
    plt.bar(df.index, df[i], width=width, bottom=bottom)
    bottom += df[i]
plt.legend(df.columns)
plt.tight_layout()
# Display the graph on the screen
plt.show()
Output:

23具有不同颜色条形的条形图
import matplotlib.pyplot as plt
import matplotlib as mp
import numpy as np
data = [8, 6, 7, 12, 9, 10, 5, 8, 9]
# Colorize the graph based on likeability:
likeability_scores = np.array(data)
data_normalizer = mp.colors.Normalize()
color_map = mp.colors.LinearSegmentedColormap(
    "my_map",
    {
        "red": [(0, 1.0, 1.0),
                (1.0, .5, .5)],
        "green": [(0, 0.5, 0.5),
                  (1.0, 0, 0)],
        "blue": [(0, 0.50, 0.5),
                 (1.0, 0, 0)]
    }
)
# Map xs to numbers:
N = len(data)
x_nums = np.arange(1, N+1)
# Plot a bar graph:
plt.bar(
    x_nums,
    data,
    align="center",
    color=color_map(data_normalizer(likeability_scores))
)
plt.xticks(x_nums, data)
plt.show()
Output:

24使用 Matplotlib 中的特定值改变条形图中每个条的颜色
import matplotlib.pyplot as plt
import matplotlib.cm as cm
from matplotlib.colors import Normalize
from numpy.random import rand
data = [2, 3, 5, 6, 8, 12, 7, 5]
fig, ax = plt.subplots(1, 1)
# Get a color map
my_cmap = cm.get_cmap('jet')
# Get normalize function (takes data in range [vmin, vmax] -> [0, 1])
my_norm = Normalize(vmin=0, vmax=8)
ax.bar(range(8), rand(8), color=my_cmap(my_norm(data)))
plt.show()
Output:

25在 Matplotlib 中绘制散点图
import matplotlib.pyplot as plt
x1 = [214, 5, 91, 81, 122, 16, 218, 22]
x2 = [12, 125, 149, 198, 22, 26, 28, 32]
plt.scatter(x1, x2)
# Set X and Y axis labels
plt.xlabel('Demand')
plt.ylabel('Price')
#Display the graph
plt.show()
Output:

26使用单个标签绘制散点图
import numpy as np
import matplotlib.pyplot as plt
N = 6
data = np.random.random((N, 4))
labels = ['point{0}'.format(i) for i in range(N)]
plt.subplots_adjust(bottom=0.1)
plt.scatter(
    data[:, 0], data[:, 1], marker='o', c=data[:, 2], s=data[:, 3] * 1500,
    cmap=plt.get_cmap('Spectral'))
for label, x, y in zip(labels, data[:, 0], data[:, 1]):
    plt.annotate(
        label,
        xy=(x, y), xytext=(-20, 20),
        textcoords='offset points', ha='right', va='bottom',
        bbox=dict(boxstyle='round,pad=0.5', fc='yellow', alpha=0.5),
        arrowprops=dict(arrowstyle='->', connectionstyle='arc3,rad=0'))
plt.show()
Output:

27用标记大小绘制散点图
import matplotlib.pyplot as plt
x1 = [214, 5, 91, 81, 122, 16, 218, 22]
x2 = [12, 125, 149, 198, 22, 26, 28, 32]
plt.figure(1)
# You can specify the marker size two ways directly:
plt.plot(x1, 'bo', markersize=20)  # blue circle with size 10
plt.plot(x2, 'ro', ms=10,)  # ms is just an alias for markersize
plt.show()
Output:

28在散点图中调整标记大小和颜色
import matplotlib.pyplot as plt
import matplotlib.colors
# Prepare a list of integers
val = [2, 3, 6, 9, 14]
# Prepare a list of sizes that increases with values in val
sizevalues = [i**2*50+50 for i in val]
# Prepare a list of colors
plotcolor = ['red','orange','yellow','green','blue']
# Draw a scatter plot of val points with sizes in sizevalues and
# colors in plotcolor
plt.scatter(val, val, s=sizevalues, c=plotcolor)
# Set axis limits to show the markers completely
plt.xlim(0, 20)
plt.ylim(0, 20)
plt.show()
Output:

29在 Matplotlib 中应用样式表
import matplotlib.pyplot as plt
import matplotlib.colors
import matplotlib as mpl
mpl.style.use('seaborn-darkgrid')
# Prepare a list of integers
val = [2, 3, 6, 9, 14]
# Prepare a list of sizes that increases with values in val
sizevalues = [i**2*50+50 for i in val]
# Prepare a list of colors
plotcolor = ['red','orange','yellow','green','blue']
# Draw a scatter plot of val points with sizes in sizevalues and
# colors in plotcolor
plt.scatter(val, val, s=sizevalues, c=plotcolor)
# Draw grid lines with red color and dashed style
plt.grid(color='blue', linestyle='-.', linewidth=0.7)
# Set axis limits to show the markers completely
plt.xlim(0, 20)
plt.ylim(0, 20)
plt.show()
Output:

30自定义网格颜色和样式
import matplotlib.pyplot as plt
import matplotlib.colors
# Prepare a list of integers
val = [2, 3, 6, 9, 14]
# Prepare a list of sizes that increases with values in val
sizevalues = [i**2*50+50 for i in val]
# Prepare a list of colors
plotcolor = ['red','orange','yellow','green','blue']
# Draw a scatter plot of val points with sizes in sizevalues and
# colors in plotcolor
plt.scatter(val, val, s=sizevalues, c=plotcolor)
# Draw grid lines with red color and dashed style
plt.grid(color='red', linestyle='-.', linewidth=0.7)
# Set axis limits to show the markers completely
plt.xlim(0, 20)
plt.ylim(0, 20)
plt.show()
Output: