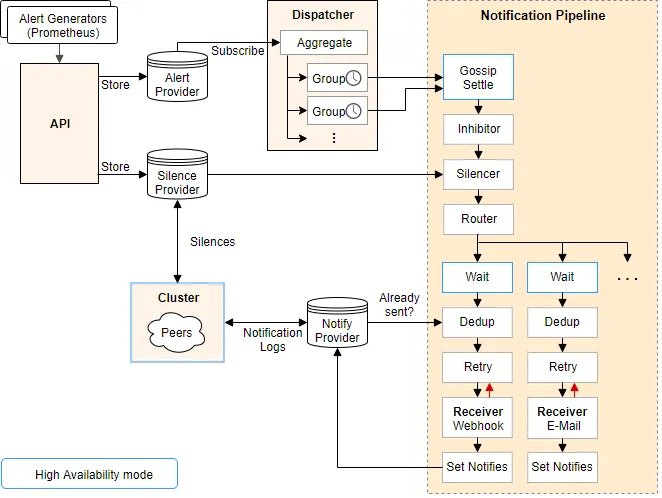
总的流程图:
alerts:
alert概念
这里先简单介绍下AlertManager中对告警的概念和状态描述。告警对应一个告警事件,包括告警名称,告警时间,告警状态以及其他告警详细说明(自定义),其描述结构如下:
[
{
    "startsAt": "2019-06-03T03:32:20.859Z",
    "endsAt": "2019-06-03T03:32:20.859Z",
    "annotations":
    {
        "additionalProp1": "string",
        "additionalProp2": "string",
        "additionalProp3": "string"
    },
    "labels":
    {
        "additionalProp1": "string",
        "additionalProp2": "string",
        "additionalProp3": "string"
    },
    "generatorURL": "string"
}
]
告警唯一标识:
唯一标识为labels所有项组合起来计算得到的一个指纹信息,所以可以认为labels组就是一个唯一标识。他来进行告警合并和更新告警状态。
参考代码如下:
// Fingerprint returns a unique hash for the alert. It is equivalent to
// the fingerprint of the alert's label set.
func (a *Alert) Fingerprint() Fingerprint {
    return a.Labels.Fingerprint()
}
// labelSetToFingerprint works exactly as LabelsToSignature but takes a LabelSet as
// parameter (rather than a label map) and returns a Fingerprint.
func labelSetToFingerprint(ls LabelSet) Fingerprint {
    if len(ls) == 0 {
        return Fingerprint(emptyLabelSignature)
    }


    labelNames := make(LabelNames, 0, len(ls))
    for labelName := range ls {
        labelNames = append(labelNames, labelName)
    }
    sort.Sort(labelNames)

    sum := hashNew()
    for _, labelName := range labelNames {
        sum = hashAdd(sum, string(labelName))
        sum = hashAddByte(sum, SeparatorByte)
        sum = hashAdd(sum, string(ls[labelName]))
        sum = hashAddByte(sum, SeparatorByte)
    }
    return Fingerprint(sum)
}
告警状态:
firing和resolved,这个值是manager根据收到了alert结构来自行判断并赋值的,manager是怎么判断firing呢?
firing: endsAt为空,或者当前时间小于等于endsAt时为告警。
resolved:endsAt不为空且大于当前时间
参考代码如下:
// Resolved returns true iff the activity interval ended in the past.
func (a *Alert) Resolved() bool {
    return a.ResolvedAt(time.Now())
}


// ResolvedAt returns true off the activity interval ended before
// the given timestamp.
func (a *Alert) ResolvedAt(ts time.Time) bool {
    if a.EndsAt.IsZero() {
        return false
    }
    return !a.EndsAt.After(ts)
}
router
路由可以是一个树形结构,通过这个结构可以灵活的配置一个告警的流转路径。
根节点:router,根节点。父节点所有属性可以被子节点继承,所以根节点的属性相当于全局默认属性。
子节点:routers,子节点可以是0个或多个,子节点可以单独配置属性以覆盖父节点的属性。
每个router可以包含以下属性
流程控制:
- match,match_re 是匹配规则,这个是每个router选择的依据。前者是等于匹配,后者是正则匹配。
- continue,告警是否继续向下路由,如果是否则终止于此节点不再向下路由。
- group规则:告警聚合规则
receiver:指定接收端,可以理解为处理方式。
group
分组操作主要是应用于将同一类告警归集为一个告警通知中,
一个特别典型的应用场景:当某核心服务或组件故障,可能引发成百上千的同类型告警,此时这个分组聚合,就会使告警通知有效减少,使告警通知保持清晰,有效。
分组有三个参数:
group by:指定分组依据哪个label,可以是多个以逗号隔开。
group_wait:分组聚合时间窗口,当第一个新分组开始到发送告警的等待时间,系统会将这段时间的同组告警合并为一条。
group_interval :同一分组的告警发送间隔,如果分组1已经成功发送了,后来的告警也还属于分组1,则等待这个间隔时间后再发送。
storage
不支持历史存储,只存储告警快照
(1)告警状态快照,未恢复的告警。存储周期可以配置,默认120小时
结构:map,key GroupKey:r.GroupName,/r.Integration,/r.Idx value:MeshEntry
具体结构如下:
type MeshEntry struct {
 // The original raw notify log entry.
 Entry *Entry `protobuf:"bytes,1,opt,name=entry,proto3" json:"entry,omitempty"`
 // A timestamp indicating when the mesh peer should evict
 // the log entry from its state.
 ExpiresAt time.Time `protobuf:"bytes,2,opt,name=expires_at,json=expiresAt,proto3,stdtime" json:"expires_at"`
 XXX_NoUnkeyedLiteral struct{} `json:"-"`
 XXX_unrecognized []byte `json:"-"`
 XXX_sizecache int32 `json:"-"`
}
type Entry struct {
 // The key identifying the dispatching group.
 GroupKey []byte `protobuf:"bytes,1,opt,name=group_key,json=groupKey,proto3" json:"group_key,omitempty"`
 // The receiver that was notified.
 Receiver *Receiver `protobuf:"bytes,2,opt,name=receiver,proto3" json:"receiver,omitempty"`
 // Hash over the state of the group at notification time.
 // Deprecated in favor of FiringAlerts field, but kept for compatibility.
 GroupHash []byte `protobuf:"bytes,3,opt,name=group_hash,json=groupHash,proto3" json:"group_hash,omitempty"`
 // Whether the notification was about a resolved alert.
 // Deprecated in favor of ResolvedAlerts field, but kept for compatibility.
 Resolved bool `protobuf:"varint,4,opt,name=resolved,proto3" json:"resolved,omitempty"`
 // Timestamp of the succeeding notification.
 Timestamp time.Time `protobuf:"bytes,5,opt,name=timestamp,proto3,stdtime" json:"timestamp"`
 // FiringAlerts list of hashes of firing alerts at the last notification time.
 FiringAlerts []uint64 `protobuf:"varint,6,rep,packed,name=firing_alerts,json=firingAlerts,proto3" json:"firing_alerts,omitempty"`
 // ResolvedAlerts list of hashes of resolved alerts at the last notification time.
 ResolvedAlerts []uint64 `protobuf:"varint,7,rep,packed,name=resolved_alerts,json=resolvedAlerts,proto3" json:"resolved_alerts,omitempty"`
 XXX_NoUnkeyedLiteral struct{} `json:"-"`
 XXX_unrecognized []byte `json:"-"`
 XXX_sizecache int32 `json:"-"`
}
(2)告警静音状态。
存储周期由静音规则配置。