vmstat
vmstat是一个查看虚拟内存(Virtual Memory)使用状况的工具,使用vmstat命令可以得到关于进程、内存、内存分页、堵塞IO、traps及CPU活动的信息。本文介绍了虚拟内存的运行原理,下面一起来学习学习。
testone:~# vmstat --help
vmstat: invalid option -- '-'
usage: vmstat [-V] [-n] [delay [count]]
-V prints version.
-n causes the headers not to be reprinted regularly.
-a print inactive/active page stats.
-d prints disk statistics
-D prints disk table
-p prints disk partition statistics
-s prints vm table
-m prints slabinfo
-S unit size
delay is the delay between updates in seconds.
unit size k:1000 K:1024 m:1000000 M:1048576 (default is K)
count is the number of updates.
vmstat [-a] [-n] [-S unit] [delay [ count]]
vmstat [-s] [-n] [-S unit]
vmstat [-m] [-n] [delay [ count]]
vmstat [-d] [-n] [delay [ count]]
vmstat [-p disk partition] [-n] [delay [ count]]
vmstat [-f]
vmstat [-V]
-a:显示活跃和非活跃内存
-f:显示从系统启动至今的fork数量
-m:显示slabinfo
-n:只在开始时显示一次各字段名称。
-s:显示内存相关统计信息及多种系统活动数量。
delay:刷新时间间隔。如果不指定,只显示一条结果。
count:刷新次数。如果不指定刷新次数,但指定了刷新时间间隔,这时刷新次数为无穷。
-d:显示磁盘相关统计信息。
-p:显示指定磁盘分区统计信息
-S:使用指定单位显示。参数有 k 、K 、m 、M ,分别代表1000、1024、1000000、1048576字节(byte)。默认单位为K(1024 bytes)
-V:显示vmstat版本信息。
例一:每2秒输出一条结果
testone~# vmstat 2
procs -----------memory---------- ---swap-- -----io---- -system-- ----cpu----
r b swpd free buff cache si so bi bo in cs us sy id wa
4 1 5684 120532 1268 579960 0 0 0 0 0 0 4 2 92 3
2 0 5684 120556 1396 579968 0 0 712 188 927 3021 20 12 64 4
2 0 5684 120044 1360 579780 0 0 688 113 772 2274 20 10 67 2
1 0 5684 119472 1352 579660 0 0 692 79 802 3004 20 10 68 2
1 0 5684 119848 1348 578596 0 0 726 185 782 2552 21 9 68 2
2 0 5684 119072 1404 578264 0 0 338 185 1049 2656 24 11 62 3
3 0 5804 119664 1408 577288 0 60 492 321 879 2102 22 11 66 1
1 0 5804 118984 1424 577244 0 0 768 52 842 5193 23 10 64 3
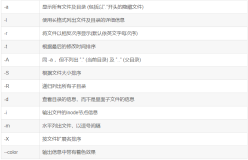
字段说明:
Procs(进程):
r: 运行队列中进程数量
b: 等待IO的进程数量
Memory(内存):
swpd: 使用虚拟内存大小
free: 可用内存大小
buff: 用作缓冲的内存大小
cache: 用作缓存的内存大小
Swap:
si: 每秒从交换区写到内存的大小
so: 每秒写入交换区的内存大小
IO:(现在的Linux版本块的大小为1024bytes)
bi: 每秒读取的块数
bo: 每秒写入的块数
系统:
in: 每秒中断数,包括时钟中断。
cs: 每秒上下文切换数。
CPU(以百分比表示):
us: 用户进程执行时间(user time)
sy: 系统进程执行时间(system time)
id: 空闲时间(包括IO等待时间)
wa: 等待IO时间
例二:显示活跃和非活跃内存
使用-a选项显示活跃和非活跃内存时,所显示的内容除增加inact和active外,其他显示内容同例一
testone:~# vmstat -a 2
procs -----------memory---------- ---swap-- -----io---- -system-- ----cpu----
r b swpd free inact active si so bi bo in cs us sy id wa
37 0 3536 506728 395420 842176 0 0 0 0 0 0 4 2 92 3
30 0 3536 504376 395392 843648 0 0 108 70 860 1286 96 3 1 0
43 1 3536 489056 395768 859328 0 0 272 782 1137 1635 94 3 4 0
37 0 3536 487056 396384 860384 0 0 372 232 1034 1581 93 4 2 0
49 0 3536 461972 396608 885428 0 0 238 137 1409 1884 87 7 6 0
59 0 3536 461076 397016 885856 0 0 220 523 463 1240 97 2 1 0
Memory(内存):
inact: 非活跃内存大小(当使用-a选项时显示)
active: 活跃的内存大小(当使用-a选项时显示)