监控作为度量可视化工具在服务治理中一直是承担比较重要的角色。一个良好的架构设计,监控一定是完善且使用便捷的。这篇文章我将会介绍Go微服务的度量与监控方案,参照我的使用经验,在Consul、Kubernetes不同部署环境下的使用。
方案选择上我们采用流行的Prometheus+Grafana方案,相对Graphite、InfluxDB Prometheus采用的主动拉取的方案的,大大降低了接入难度。
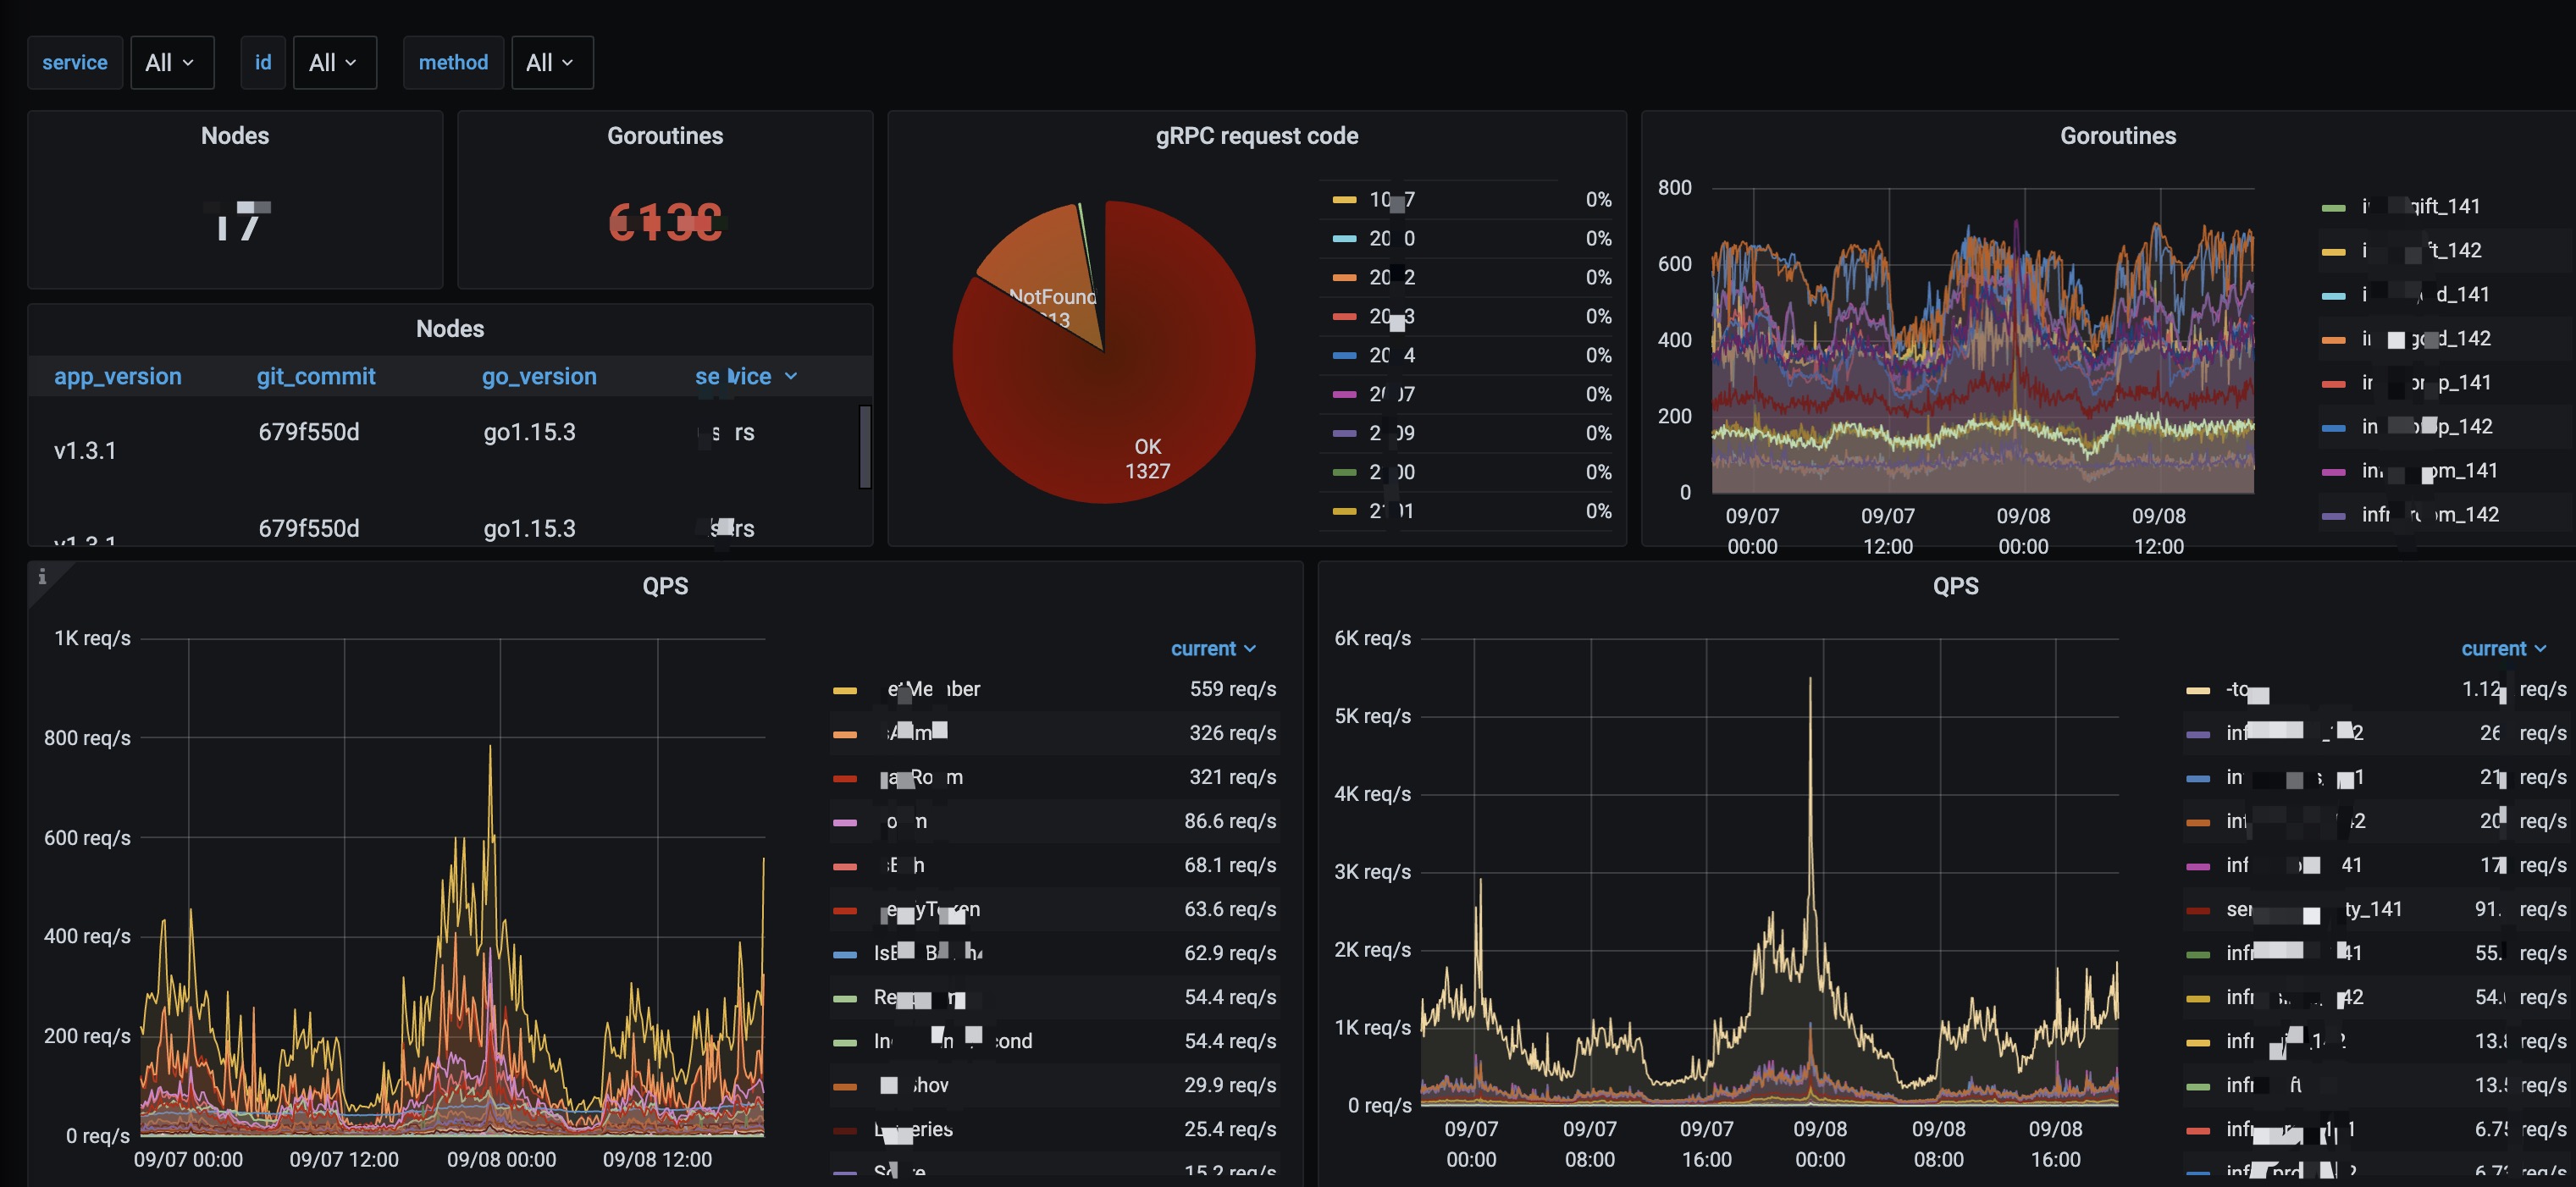
一、监控样例
二、什么是度量
度量(Metrics), 简单来说就是个数字,它可以是当前服务内存使用率,可以是基于时间的访问次数,度量是我们用来评价系统状态的一个确定值, 是评价是否达到某个指标的计算来源。
1. 度量类型
根据使用场景的不同,我们常用的有Gauge、Counter、Histogram、Summary等几种数据类型。
其中Gauge是要用来存储一些诸如CPU 内存之类的瞬时值;Counter用来存储诸如访问次数之类的累积值;Histogram要比较复杂些,它常用来计算服务响应时间。
2. 我们该怎么设计度量
度量方案设计与度量值确定需要我们对服务架构有一定了解,比如GRPC微服务 我们关心的就是QPS、延迟、成功率(错误率)等数据; API Gateway 我们除了关心上述几个度量值,我们还关心并发请求数量,当前带宽等数据;无论哪种类型的服务与业务我们都关心运行环境的CPU/内存使用率等数据,以确定当前资源水位是否安全,是否有扩缩容的必要。
余下内容我们重点介绍业务服务度量,服务器与中间件监控请参照 Prometheus文档选择开源exporters。
三、度量应该怎么记录
1.数据记录
上文提到服务数据度量大部分采用侵入式方案,不同于服务网格Sidecar的采集方式,侵入式打点能获取到更多的状态数据。下面的样例就是 prometheus 官方提供的SDK使用样例,非常简单。同时Prometheus还提供Java、Python、Rudy等官方SDK。
package main

import (
    "log"
    "net/http"

    "github.com/prometheus/client_golang/prometheus"
    "github.com/prometheus/client_golang/prometheus/promhttp"
)

var (
    cpuTemp = prometheus.NewGauge(prometheus.GaugeOpts{


        Name: "cpu_temperature_celsius",
        Help: "Current temperature of the CPU.",
    })
    hdFailures = prometheus.NewCounterVec(
        prometheus.CounterOpts{


            Name: "hd_errors_total",
            Help: "Number of hard-disk errors.",
        },
        []string{

   "device"},
    )
)

func init() {


    // Metrics have to be registered to be exposed:
    prometheus.MustRegister(cpuTemp)
    prometheus.MustRegister(hdFailures)
}

func main() {


    cpuTemp.Set(65.3)
    hdFailures.With(prometheus.Labels{

   "device":"/dev/sda"}).Inc()

    // The Handler function provides a default handler to expose metrics
    // via an HTTP server. "/metrics" is the usual endpoint for that.
    http.Handle("/metrics", promhttp.Handler())
    log.Fatal(http.ListenAndServe(":8080", nil))
}
2.GRPC下的使用方案
对于GRPC服务,我推荐使用三方包来简化接入流程,尽可能少的对业务代码产生影响。
- go-grpc-prometheus grpc ecosystem提供的一个封装方案,采用拦截器方案。优点: 支持grpc v1.26.x 以下版本,代码基本无侵入;缺点:纯面向 GRPC的度量,扩展不便。
- QGRPC 优点:代码侵入较小,提供更多grpc封装; 缺点:使用不灵活。
- Qkits 优点:能方便扩充度量;缺点:侵入项目略多,文档支持不够(当然代码也没几行),GRPC需要1.26以上。
四、度量采集
对于一个配置好度量的服务,应该能通过 http://localhost/metrics 访问到类似如下数据
# HELP go_gc_duration_seconds A summary of the pause duration of garbage collection cycles.
# TYPE go_gc_duration_seconds summary
go_gc_duration_seconds{quantile="0"} 7.7299e-05
go_gc_duration_seconds{quantile="0.25"} 9.7869e-05
go_gc_duration_seconds{quantile="0.5"} 0.000115081
go_gc_duration_seconds{quantile="0.75"} 0.000141982
go_gc_duration_seconds{quantile="1"} 0.088763487
go_gc_duration_seconds_sum 54.35006894
go_gc_duration_seconds_count 93984
# HELP go_goroutines Number of goroutines that currently exist.
# TYPE go_goroutines gauge

....

qietv_grpc_server_request_total{method="WinnerList",service="rpc.gRPCLottery"} 11
数据采集
1. VM 与Docker 部署方案。
参考配置
scrape_configs:
  # The job name is added as a label `job=<job_name>` to any timeseries scraped from this config.
  - job_name: qietv_go
    consul_sd_configs:
      - server: 172.17.3.79:8500
        datacenter: tx
        tags:
          - metrics
    relabel_configs:
      - source_labels:  ["__meta_consul_service_id"]
        target_label: "service_id"
      - source_labels:  ["__meta_consul_service"]
        target_label: "service"
  - job_name: 'mongo'
    static_configs:
    - targets: ['172.17.1.130:9216']
  - job_name: etcd
    scheme: https
    tls_config:
      cert_file: /opt/etcd/cert/79/client.crt
      key_file: /opt/etcd/cert/79/client.key
      insecure_skip_verify: true
    static_configs:
    - targets: ['172.17.3.79:2379','172.17.3.80:2379','172.17.3.81:2379']
2. 基于Consul服务发现的微服务集群
参考
scrape_configs:
  # The job name is added as a label `job=<job_name>` to any timeseries scraped from this config.
  - job_name: qietv_go
    consul_sd_configs:
      - server: 172.17.3.79:8500
        datacenter: tx
        tags:
          - metrics
    relabel_configs:
      - source_labels:  ["__meta_consul_service_id"]
        target_label: "service_id"
      - source_labels:  ["__meta_consul_service"]
        target_label: "service"
3. Kubernetes 环境
- 集群安装prometheus-operator
新增ServiceMonitor资源
kubectl apply -n monitoring -f << apiVersion: monitoring.coreos.com/v1 kind: ServiceMonitor spec: endpoints: - interval: 10s port: http namespaceSelector: matchNames: - appnamespace selector: matchLabels: metrics: prometheus targetLabels: - app - service - project - metrics EOF- Kubernetes Workload 添加Selecter
apiVersion: apps/v1
kind: Deployment
metadata:
labels:
  app: nginx
  metrics: promethues
