Ganglia:分布式监控系统
Ganglia的核心包含gmond、gmetad以及一个Web前端。主要是用来监控系统性能,如:cpu 、mem、硬盘利用率, I/O负载、网络流量情况等,通过曲线很容易见到每个节点的工作状态,对合理调整、分配系统资源,提高系统整体性能起到重要作用
Ganglia监控端安装
1、安装依赖的软件包
|
1
|
yum
install
ntp vim-enhanced gcc gcc-c++ flex bison autoconf automake
bzip2
-devel ncurses-devel zlib-devel libjpeg-devel libpng-devel libtiff-devel freetype-devel libXpm-devel gettext-devel pam-devel python-devel perl perl-devel expat expat-devel pcre pcre-devel apr apr-devel cairo-devel和pango-devel
|
需要安装rrdtool工具 最新版本的ganglia已可以直接使用yum安装rrdtool工具即可,
2、安装confuse
|
1
2
3
4
5
|
wget http:
//download
.savannah.gnu.org
/releases/confuse/confuse-2
.7.
tar
.gz
tar
zxf confuse-2.7.
tar
.gz
cd
confuse-2.7
.
/configure
CFLAGS=-fPIC --disable-nls ;
make
;
make
install
cd
..
|
3、安装ganglia
|
1
2
3
4
5
6
7
8
9
10
11
12
13
14
15
|
wget http:
//downloads
.sourceforge.net
/project/ganglia/ganglia
%20monitoring%20core
/3
.3.1
/ganglia-3
.3.1.
tar
.gz
tar
zxf ganglia-3.3.1.
tar
.gz
cd
ganglia-3.3.1
#server 监控端
.
/configure
--prefix=
/usr/local/ganglia
--with-static-modules --
enable
-gexec --
enable
-status --with-gmetad --with-python=
/usr
--with-librrd=
/usr/local/rrdtool
--with-libexpat=
/usr
--with-libconfuse=
/usr/local
--with-libpcre
make
make
install
cd
gmetad
cp
gmetad.conf
/opt/modules/ganglia/etc/
cp
gmetad.init
/etc/init
.d
/gmetad
vim
/etc/init
.d
/gmetad
修改为GMETAD=
/usr/local/ganglia/sbin/gmetad
ip route add 239.2.11.71 dev eth0
##添加广播路由
|
Ganglia:被监控端安装:
1、安装依赖的软件包
|
1
|
yum
install
ntp vim-enhanced gcc gcc-c++ flex bison autoconf automake
bzip2
-devel ncurses-devel zlib-devel libjpeg-devel libpng-devel libtiff-devel freetype-devel libXpm-devel gettext-devel pam-devel python-devel perl perl-devel expat expat-devel pcre pcre-devel apr apr-devel
|
|
1
2
3
4
5
|
wget http:
//download
.savannah.gnu.org
/releases/confuse/confuse-2
.7.
tar
.gz
tar
zxf confuse-2.7.
tar
.gz
cd
confuse-2.7
.
/configure
CFLAGS=-fPIC --disable-nls ;
make
;
make
install
cd
..
|
2、安装ganglia
|
1
2
3
4
5
6
7
8
9
10
11
12
13
14
15
16
17
18
|
wget http:
//downloads
.sourceforge.net
/project/ganglia/ganglia
%20monitoring%20core
/3
.3.1
/ganglia-3
.6.0.
tar
.gz
tar
zxf ganglia-3.6.0.
tar
.gz
cd
ganglia-3.6.0
.
/configure
--prefix=
/usr/local/ganglia
--
enable
-gexec --
enable
-status --with-python=
/usr
--with-libapr --with-libconfuse=
/usr/local
--with-libexpat=
/usr
--with-libpcre
make
make
install
cd
gmond
.
/gmond
-t >
/usr/local/ganglia/etc/gmond
.conf
cp
gmetad.init
/etc/init
.d
/gmond
vim
/etc/init
.d
/gmond
修改为:
GMETAD=
/usr/local/ganglia/sbin/gmond
mkdir
/usr/local/ganglia/lib64/ganglia/python_modules
cp
python_modules/*/*.py
/usr/local/ganglia/lib64/ganglia/python_modules
ip route add 239.2.11.71 dev eth0
|
安装已完成,过程简单。
Web网页页面在https://github.com/ganglia/ganglia-web
自行下载配置使用即可。
下面来监控,使其能正常工作和使用。
ganglia是分布式监控系统,也可以不使用分布来用。下面就分两种方式来解说。
1、不使用分布式来监控的方式
|
1
2
3
4
5
6
7
8
9
10
11
12
|
服务器配置文件
修改两项:
data_source
"test1"
192.168.107.2
data_source
"test2"
172.16.1.4
##这里分了两个监控组
data_source是关键字,
“test1,test2” 是监控主机组的名字,全局要唯一。 后面跟着要监控的ip或主机名,如果有多个可以用空格隔开就可以了
gridname
"Test"
这个是定义监控集的名字,
|
如下所示:


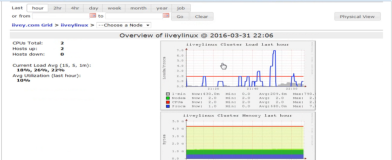
现在ganglia还没有启动,在启动之前执行下面命令:
可以使用命令查看是不是有配置错误的地方导致启动不了
/usr/local/ganglia/sbin/gmetad -d 5
出错的地方应该可以修改配置文件gmetad.conf得到修正、
service gmetad start 来启动服务
好了,再看客户端的配置吧
|
1
2
3
4
5
6
7
8
9
10
11
12
13
14
15
16
17
18
19
20
21
22
23
24
25
26
27
28
29
30
31
32
33
34
35
36
37
38
39
40
41
42
43
44
45
46
47
48
49
50
51
52
53
54
55
56
57
58
59
60
61
62
63
64
|
在客户端配置
globals {
daemonize =
yes
setuid =
yes
user = nobody
debug_level = 0
max_udp_msg_len = 1472
mute = no
deaf = no
allow_extra_data =
yes
host_dmax = 86400 /*secs. Expires (removes from web interface) hosts
in
1 day */
host_tmax = 20 /*secs */
cleanup_threshold = 300 /*secs */
gexec = no
# By default gmond will use reverse DNS resolution when displaying your hostname
# Uncommeting following value will override that value.
# override_hostname = "mywebserver.domain.com"
# If you are not using multicast this value should be set to something other than 0.
# Otherwise if you restart aggregator gmond you will get empty graphs. 60 seconds is reasonable
send_metadata_interval = 0 /*secs */
}
cluster {
name =
"test1"
####需要修改与服务器端设定相同的名字 ###
owner =
"nobody"
###修改为nobody
latlong =
"unspecified"
url =
"unspecified"
}
host {
location =
"unspecified"
}
udp_send_channel {
#bind_hostname = yes # Highly recommended, soon to be default.
# This option tells gmond to use a source address
# that resolves to the machine's hostname. Without
# this, the metrics may appear to come from any
# interface and the DNS names associated with
# those IPs will be used to create the RRDs.
mcast_join = 239.2.11.71
##与设定的要一样哦
port = 8649
##默认端口
ttl = 1
}
udp_recv_channel {
mcast_join = 239.2.11.71
##与设定的要一样哦
port = 8649
##默认端口
bind = 239.2.11.71
retry_bind =
true
# Size of the UDP buffer. If you are handling lots of metrics you really
# should bump it up to e.g. 10MB or even higher.
# buffer = 10485760
}
/* You can specify as many tcp_accept_channels as you like to share
an xml description of the state of the cluster */
tcp_accept_channel {
port = 8649
# If you want to gzip XML output
gzip_output = no
}
|
启动客户端
在客户端也是可以使用debug来调试配置是不是有错
/usr/local/ganglia/sbin/gmond -d 5
service gmond start
下面来说第2种分布式监控系统
2、分布式监控
主gmetad 多个次gmetad 被监控点
|------ gmond
_ gmetad---|------ gmond
| |------ gmond
|
gmetad-------|_ gmetad---|-------gmond
| | |------gmond
| |__ gmetad----|------gmond
| |------gmond
|_gmond
|-gmond
从面可以看到多个gmetad点和多个gmond点
主要是从次节点的配置:
|
1
2
3
4
5
6
7
8
9
10
11
12
13
14
15
16
17
18
19
20
21
22
23
24
25
26
27
28
29
30
31
32
33
34
35
36
37
38
39
40
|
下面对次节点配置如下
gmetad.conf
配置如下:
data_source
"test2"
localhost ip
/hostname
gmond.conf配置文件如下:
cluster {
name =
"test2"
owner =
"nobody"
latlong =
"unspecified"
url =
"unspecified"
}
host {
location =
"unspecified"
}
udp_send_channel {
#bind_hostname = yes # Highly recommended, soon to be default.
# This option tells gmond to use a source address
# that resolves to the machine's hostname. Without
# this, the metrics may appear to come from any
# interface and the DNS names associated with
# those IPs will be used to create the RRDs.
mcast_join = 172.16.1.4
####次节点的ip地址。也就次节点自己的ip地址
port = 8649
}
udp_recv_channel {
port = 8649
family = inet4
}
/* You can specify as many tcp_accept_channels as you like to share
an xml description of the state of the cluster */
tcp_accept_channel {
port = 8649
}
|
次节点下的gmond节点配置与次节点gmond的配置一样,直接copy一份到gmond上面就好。
关于Ganglia的主要配置到此为止了。Ganglia的views功能还在研究当中,不过这个view添加很麻烦,我配置的好久也,只是在配置文件中添加,在页面上没有添加成功,因为页面上没有添加view的功能,,这个很不爽,网上查了很多资料,只是在官网上找到一点相关E文,,,,,,希路过的大牛能指点一二,多谢!
本文转自 ZhouLS 51CTO博客,原文链接:http://blog.51cto.com/zhou123/1543105