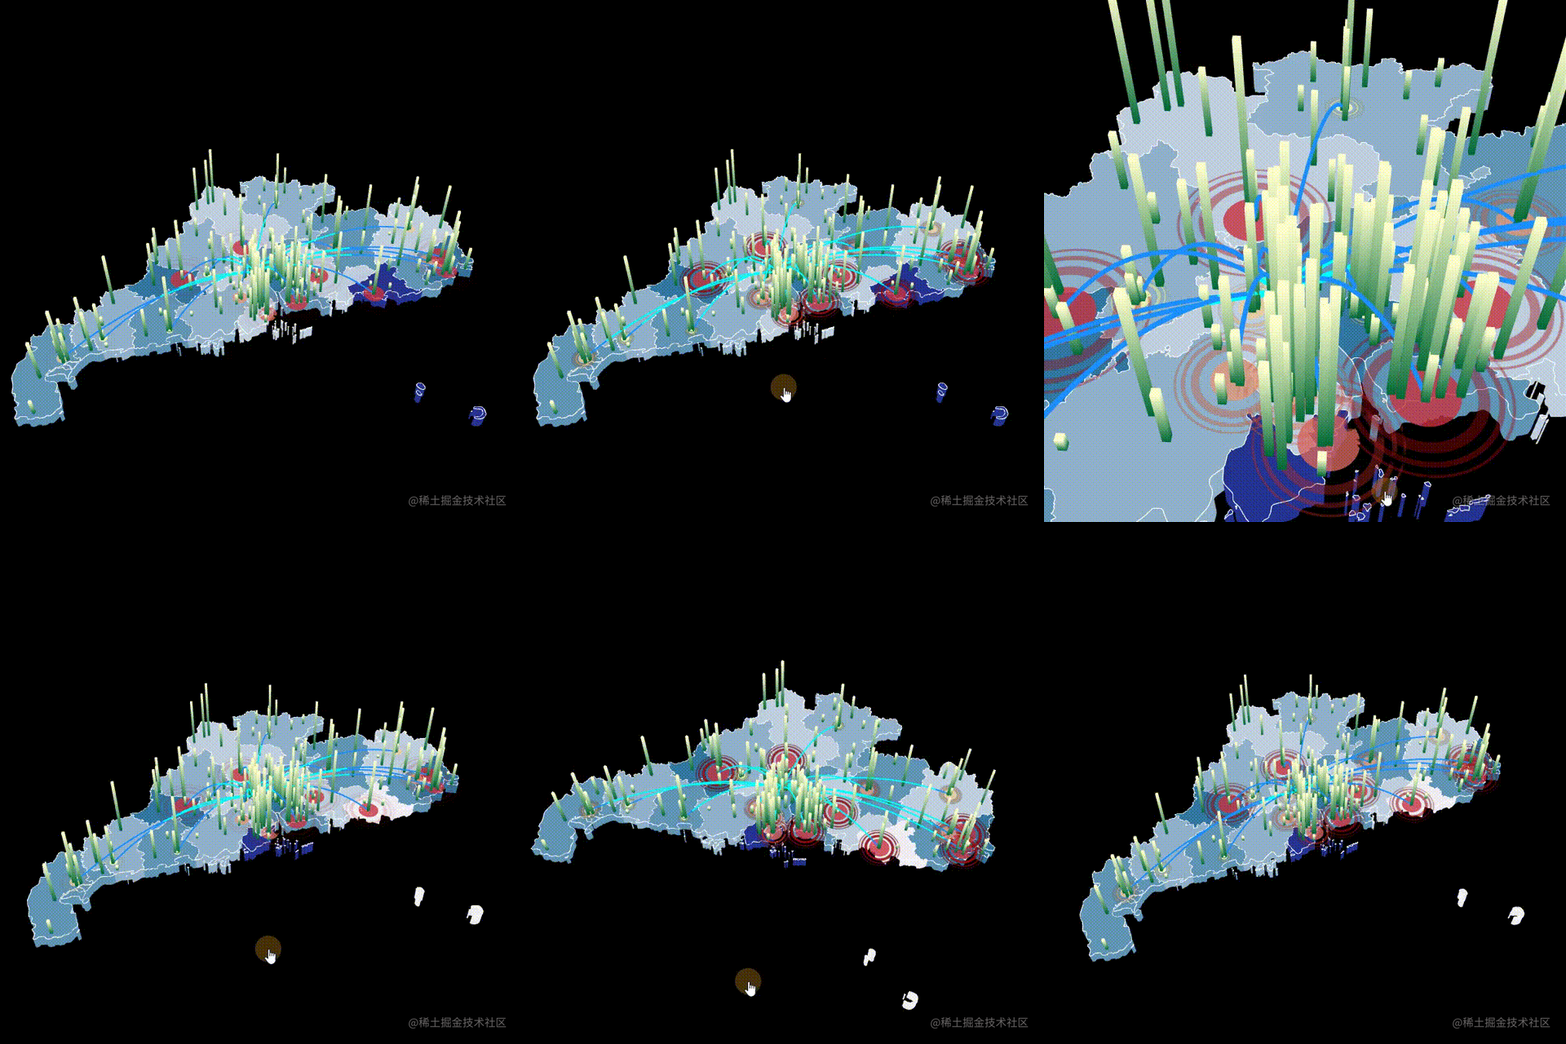
常用的3D区块地图除了那个区块,还要满足波纹散点、渐变柱体、飞线、下钻上卷、视角适配等,点开我,这就安排!用Three.js给你搞一个!
1.准备工作
(1) 获取GeoJson
阿里的地理数据工具:http://datav.aliyun.com/portal/school/atlas/area_selector#&lat=33.50475906922609&lng=104.32617187499999&zoom=4
export function queryGeojson(adcode, isFull = true) {


  return new Promise((resolve, reject) => {


    fetch(
      `https://geo.datav.aliyun.com/areas_v3/bound/geojson?code=${

     adcode + (isFull ? '_full' : '')}`
    )
      .then((res) => res.json())
      .then((data) => {


        console.log(data);
        resolve(data);
      })
      .catch(async (err) => {


        if (isFull) {


          let res = await queryGeojson(adcode, false);
          resolve(res);
        } else {


          reject();
        }
      });
(2) 经纬度转墨卡托投影
这里使用的是d3geo,有一些Geojson不走经纬度的标准,直接是墨卡托投影坐标,所以需要判断一下,在经纬度范围才对它进行墨卡托投影坐标转换
import d3geo from './d3-geo.js';
let geoFun = d3geo.geoMercator().scale(180);
export const latlng2px = (pos) => {


  if (pos[0] >= -180 && pos[0] <= 180 && pos[1] >= -90 && pos[1] <= 90) {


    return geoFun(pos);
  }
  return pos;
};
(3)获取区块基本信息
遍历所有的坐标点,获取坐标范围,中心点,以及缩放值(该值用于下钻上卷的时候维持元素缩放比例)
export function getGeoInfo(geojson) {


  let bounding = {


    minlat: Number.MAX_VALUE,
    minlng: Number.MAX_VALUE,
    maxlng: 0,
    maxlat: 0
  };
  let centerM = {


    lat: 0,
    lng: 0
  };
  let len = 0;
 //遍历点
  geojson.features.forEach((a) => {


    if (a.geometry.type == 'MultiPolygon') {


      a.geometry.coordinates.forEach((b) => {


        b.forEach((c) => {


          c.forEach((item) => {


            let pos = latlng2px(item);
    //经纬度转墨卡托投影坐标换失败
            if (Number.isNaN(pos[0]) || Number.isNaN(pos[1])) {


              console.log(item, pos);
              return;
            }
            centerM.lng += pos[0];
            centerM.lat += pos[1];
            if (pos[0] < bounding.minlng) {


              bounding.minlng = pos[0];
            }
            if (pos[0] > bounding.maxlng) {


              bounding.maxlng = pos[0];
            }
            if (pos[1] < bounding.minlat) {


              bounding.minlat = pos[1];
            }
            if (pos[1] > bounding.maxlat) {


              bounding.maxlat = pos[1];
            }

            len++;

          });
        });
      });
    } else {


      a.geometry.coordinates.forEach((c) => {


        c.forEach((item) => {


         //...
        });
      });
    }
  });
  centerM.lat = centerM.lat / len;
  centerM.lng = centerM.lng / len;
  //元素缩放比例
  let scale = (bounding.maxlng - bounding.minlng) / 180;
  return {

    bounding, centerM, scale };
}
(4)渐变色
/***
 * 获取渐变色数组
 * @param {string} startColor 开始颜色
 * @param {string} endColor  结束颜色
 * @param {number} step 颜色数量
 */
export function getGadientArray(startColor, endColor, step) {


  let {

    red: startR, green: startG, blue: startB } = getColor(startColor);
  let {

    red: endR, green: endG, blue: endB } = getColor(endColor);

  let sR = (endR - startR) / step; //总差值
  let sG = (endG - startG) / step;
  let sB = (endB - startB) / step;
  let colorArr = [];
  for (let i = 0; i < step; i++) {


    //计算每一步的hex值

    let c =
      'rgb(' +
      parseInt(sR * i + startR) +
      ',' +
      parseInt(sG * i + startG) +
      ',' +
      parseInt(sB * i + startB) +
      ')';
    // console.log('%c' + c, 'background:' + c);

    colorArr.push(c);
  }
  return colorArr;
}
2.画有热力的3D区块
(1)基本行政区区块信息
 if (this.adcode != options.adcode || !this.geoJson) {


            //获取geojson
            let res = await queryGeojson(options.adcode, true);
            let res1 = await queryGeojson(options.adcode, false);
            this.geoJson = res;
            this.adcode = options.adcode;
            this.geoJson1 = res1;

            //获取区块信息
            let info = getGeoInfo(this.geoJson1);
            this.geoInfo = info;
            //坐标范围
            this.bounding = info.bounding;
            //元素缩放比例
            this.sizeScale = info.scale;
          }
(2)画出区块
计算热力区块:
- 生成热力颜色列表:渐变色
 let colorList = getGadientArray(
            options.regionStyle.colorList[0],
            options.regionStyle.colorList[1],
            this.colorNum
          );
- 数值分阶
let minValue;//最小值
          let maxValue;//最大值
          let valueLen;//单位长度
          if (options.data.length > 0) {


            minValue = options.data[0].value;
            maxValue = options.data[0].value;
            options.data.forEach((item) => {


              if (item.value < minValue) {


                minValue = item.value;
              }
              if (item.value > maxValue) {


                maxValue = item.value;
              }
            });
            valueLen = (maxValue - minValue) / this.colorNum;
          }
- 根据区块值所在的区间取对应颜色值
           //获取该区块热力值颜色
           let regionIdx = options.data.findIndex((item) => item.name == regionName);

            if (regionIdx >= 0) {


              let regionData = options.data[regionIdx];
              let cIdx = Math.floor((regionData.value - minValue) / valueLen);
              cIdx = cIdx >= this.colorNum ? this.colorNum - 1 : cIdx;
              regionColor = colorList[cIdx];
              }
loaderExturdeGeometry() {


          let options = this.that;
          //激活材质
          this.activeRegionMat = getBasicMaterial(THREE, options.regionStyle.emphasisColor);
          //区块组
          this.mapGroup = new THREE.Group();

        //ExturdeGeometry厚度设置
          const extrudeSettings = {


            depth: options.regionStyle.depth * this.sizeScale,
            bevelEnabled: false
          };
          //区块边框线颜色
          const lineM = new THREE.LineBasicMaterial({


            color: options.regionStyle.borderColor,
            linewidth: options.regionStyle.borderWidth
          });
//...
          for (let idx = 0; idx < this.geoJson.features.length; idx++) {


            let a = this.geoJson.features[idx];

 //...
               //多区块的行政区
            if (a.geometry.type == 'MultiPolygon') {


              a.geometry.coordinates.forEach((b) => {


                b.forEach((c) => {


                  op.c = c;
                  this.createRegion(op);
                });
              });
            } else {


            //单区块的行政区
              a.geometry.coordinates.forEach((c) => {


                op.c = c;
                this.createRegion(op);
              });
            }

          }

          this.objGroup.add(this.mapGroup);
        }
(3)每个区块形状和线框
区块形状使用的是Shape的ExtrudeGeometry,差不多就是有厚度的canvas图形
createRegion({

    c, extrudeSettings, lineM, regionName, regionColor, idx, regionIdx }) {


          const shape = new THREE.Shape();
          const points = [];
    //遍历该区块所有点画出形状
          let pos0 = latlng2px(c[0]);
          shape.moveTo(...pos0);
          let h = 0;
          points.push(new THREE.Vector3(...pos0, h));

          for (let i = 1; i < c.length; i++) {


            let p = latlng2px(c[i]);
            shape.lineTo(...p);
            points.push(new THREE.Vector3(...p, h));
          }
          shape.lineTo(...pos0);
          //添加区块形状
          const geometry = new THREE.ExtrudeGeometry(shape, extrudeSettings);
          let material = getBasicMaterial(THREE, regionColor);
          const mesh = new THREE.Mesh(geometry, material);
          mesh.name = regionName;
          mesh.IDX = regionIdx;
          mesh.rotateX(Math.PI * 0.5);
          //收集动作元素
          this.actionElmts.push(mesh);
          //添加边框
          const lineGeo = new THREE.BufferGeometry().setFromPoints(points);
          const line = new THREE.Line(lineGeo, lineM);
          line.name = 'regionline-' + idx;
          line.rotateX(Math.PI * 0.5);
            line.position.y = 0.03 * this.sizeScale;
          let group = new THREE.Group();
          group.name = 'region-' + idx;
          group.add(mesh, line);
          this.mapGroup.add(group);
        }
注意:
- shape画出来的canvas形状基于经纬度的墨卡托投影坐标作为xy坐标是竖着的,记得要旋转90度
- 避免动作检测的元素过多,还是规规矩矩收集要监听的元素
(4) 悬浮激活区块
这里需要存储原来的区块材质,赋值激活状态材质,还要根据悬浮区块计算位置与大小,显示提示文本
       doMouseAction(isChange) {


          const intersects = this.raycaster.intersectObjects(this.actionElmts, true);

          let newActiveObj;
          let options = this.that;
          if (intersects.length > 0) {


            newActiveObj = intersects[0].object;
          }

          if (
            (this.activeObj && newActiveObj && this.activeObj.name != newActiveObj.name) ||
            (!this.activeObj && newActiveObj)
          ) {


            console.log('active', newActiveObj);
            //删除旧的提示文本
            if (this.tooltip) {


              this.cleanObj(this.tooltip);
              this.tooltip = null;
            }
            //还原旧的区块材质
            if (this.regions && this.beforeMaterial) {


              this.regions.forEach((elmt) => {


                elmt.material = this.beforeMaterial;
              });
            }
            //存储旧的区块材质
            this.beforeMaterial = newActiveObj.material;

            let regions = this.actionElmts.filter((item) => item.name == newActiveObj.name);
            let regionIdx = newActiveObj.regionIdx;
            let idx = newActiveObj.idx;
            let regionName = newActiveObj.name;
            //将区块材质设置成激活状态材质
            if (regions?.length) {


              let center = new THREE.Vector3();

              regions.forEach((elmt) => {


                elmt.material = this.activeRegionMat;
                elmt.updateMatrixWorld();
                let box = new THREE.Box3().setFromObject(elmt);

                let c = box.getCenter(new THREE.Vector3());
                center.x += c.x;
                center.y += c.y;
                center.z += c.z;
              });
              //计算中心点,创建提示文本
              center.x = center.x / regions.length;
              center.y = center.y / regions.length;
              center.z = center.z / regions.length;
              newActiveObj.updateMatrixWorld();
              let objBox = new THREE.Box3().setFromObject(newActiveObj);
              this.createToolTip(regionName, regionIdx, center, objBox.getSize());
            }
            this.regions = regions;
            this.activeObj = newActiveObj;
          }
          //点击下钻
           if (this.that.isDown && isChange && newActiveObj && this.activeObj) {


          //点击后赋值子级地址编码和地址名称,重新渲染
            let f = this.geoJson.features[this.activeObj.idx];
            this.that.adcode = f.properties.adcode;
            this.that.address = f.properties.name;
            console.log('next region', this.that.adcode);
            this.createChart(this.that);
          }
        }
注意:这里不能直接用区块经纬度坐标中心点作为提示框的位置,因为我这里对区块地图做了缩放和视角适配处理,所以经纬度坐标早已物是人非,位置对不上的,只能实时根据
THREE.Box3来计算
(5)创建提示文本
createToolTip(regionName, regionIdx, center, scale) {


          let op = this.that;
          let text;
          let data;
          //文本格式化替换
          if (regionIdx >= 0) {


            data = op.data[regionIdx];
            text = op.tooltip.formatter;
          } else {


            text = '{name}';
          }

          if (text.indexOf('{name}') >= 0) {


            text = text.replace('{name}', regionName);
          }
          if (text.indexOf('{value}') >= 0) {


            text = text.replace('{value}', data.value);
          }
          let {

    mesh, canvas } = getTextSprite(
            THREE,
            text,
            op.tooltip.fontSize * this.sizeScale,
            op.tooltip.color,
            op.tooltip.bg
          );
          let s = this.latlngScale / this.sizeScale;
          //注意canvas精灵的大小要保持原始比例
          mesh.scale.set(canvas.width * 0.01 * s, canvas.height * 0.01 * s);
          let box = new THREE.Box3().setFromObject(mesh);
          this.tooltip = mesh;
          this.tooltip.position.set(center.x, center.y + scale.y + box.getSize().y, center.z);
          this.scene.add(mesh);
        }
注意canvas文本精灵的大小要保持原始比例,并且要适配当前行政区范围,要对其进行元素缩放
(6)使用区块地图
export default {


  //文本提示样式
  tooltip: {


    //字体颜色
    color: 'rgb(255,255,255)',
    //字体大小
    fontSize: 10,
    //
    formatter: '{name}:{value}',
    //背景颜色
    bg: 'rgba(30, 144 ,255,0.5)'
  },

  regionStyle: {


    //厚度
    depth: 5,
    //热力颜色
    colorList: ['rgb(241, 238, 246)', 'rgb(4, 90, 141)'],
    //默认颜色
    color: 'rgb(241, 238, 246)',
    //激活颜色
    emphasisColor: 'rgb(37, 52, 148)',
    //边框样式
    borderColor: 'rgb(255,255,255)',
    borderWidth: 1
  },
  //视角控制
  viewControl: {


    autoCamera: true,
    height: 10,
    width: 0.5,
    depth: 2,
    cameraPosX: 10,
    cameraPosY: 181,
    cameraPosZ: 116,
    autoRotate: false,
    rotateSpeed: 2000
  },
   //是否下钻
  isDown: false,
  //地址名称
  address: mapJson.name,
  //地址编码
  adcode: mapJson.adcode,
  //区块数据
  data: data.map((item) => ({


    name: item.name,
    code: item.code,
    value: parseInt(Math.random() * 180)
  })),
  }


  var map = new RegionMap();
      map.initThree(document.getElementById('map'));
      map.createChart(mapOption);

      window.map = map;
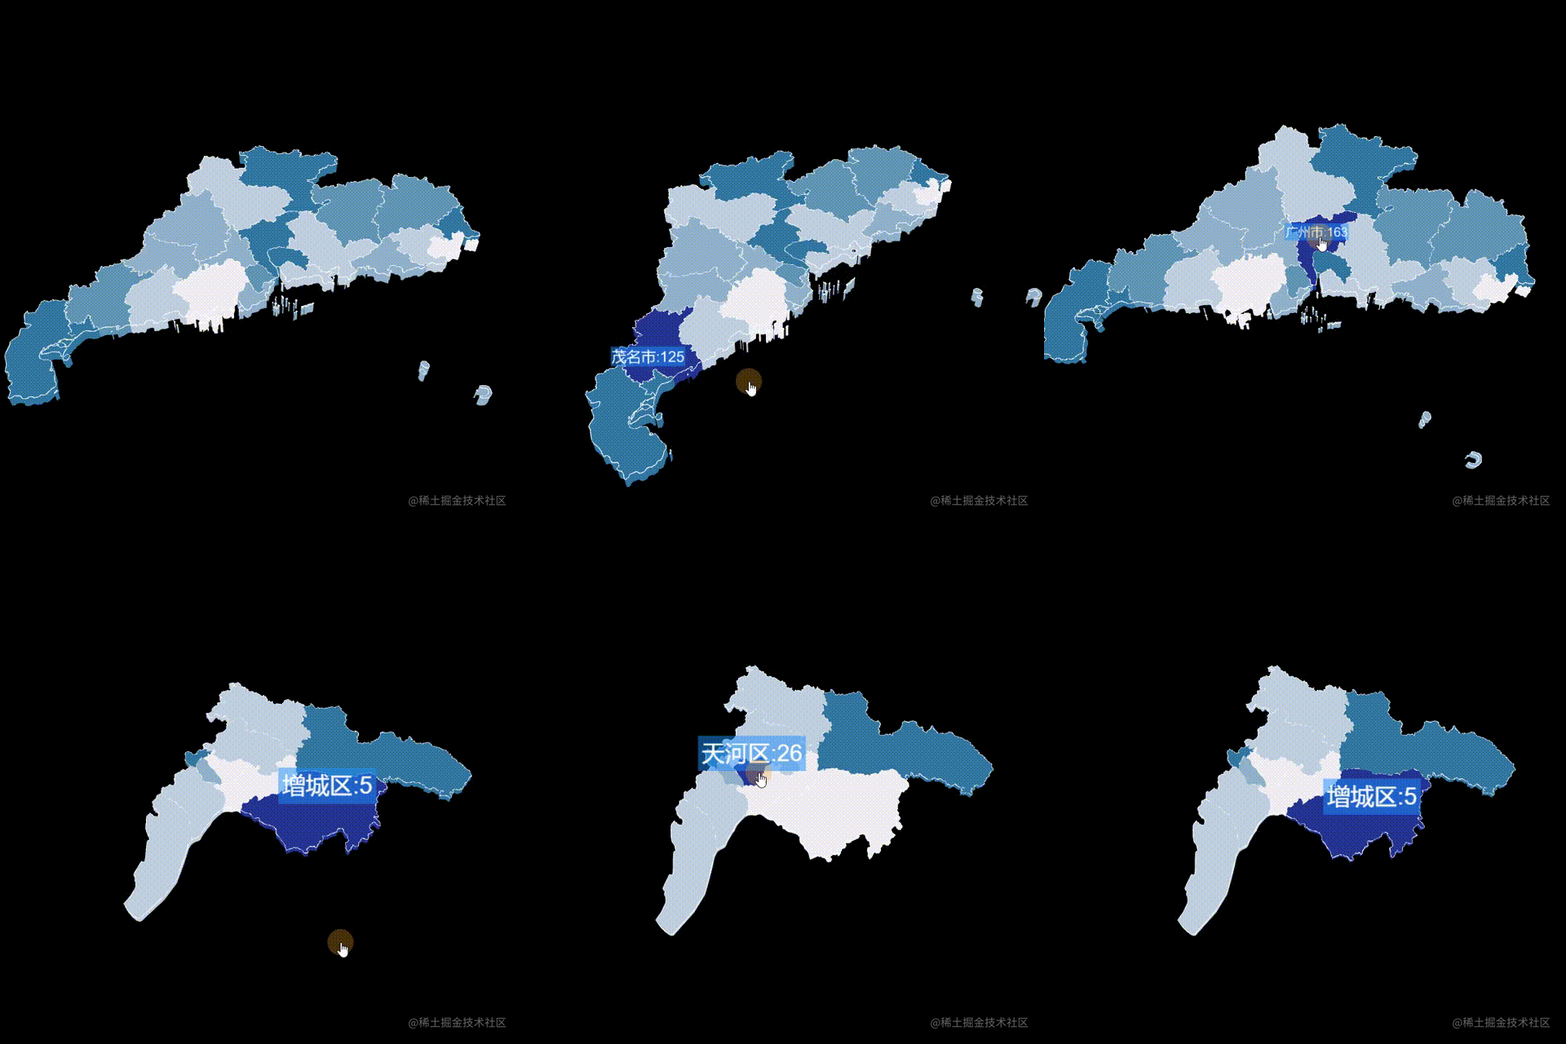
我这里没有使用光照,因为一旦增加光照就会导致每个区块的颜色出现偏差,这样可能会出现不符合UI设计的样式,该区热力值颜色不匹配等问题。
3.画散点
(1) 热力散点
散点数据情况
  let min = op.data[0].value,
            max = op.data[0].value;
          op.data.forEach((item) => {


            if (item.value < min) {


              min = item.value;
            }
            if (item.value > max) {


              max = item.value;
            }
          });

          let len = max - min;
          let unit = len / this.colorNum;
半径范围大小
let size = op.itemStyle.maxRadius - op.itemStyle.minRadius || 1;获取散点大小
              let r;
              if (len == 0) {


                r = op.itemStyle.minRadius * this.sizeScale;
              } else {


                r = ((item.value - min) / len) * size + op.itemStyle.minRadius;
                r = r * this.sizeScale;
              }
 createScatter(op, idx) {


         //...


          //热力颜色列表
          let colorList = getGadientArray(
            op.itemStyle.colorList[0],
            op.itemStyle.colorList[1],
            this.colorNum
          );
          for (let index = 0; index < op.data.length; index++) {


            let item = op.data[index];
            let pos = latlng2px([item.lng, item.lat]);
            //检查散点是否在范围内
            if (this.checkBounding(pos)) {


              //获取热力颜色...
              let cIdx = Math.floor((item.value - min) / unit);
              cIdx = cIdx >= this.colorNum ? this.colorNum - 1 : cIdx;
              let color = colorList[cIdx];
              let c = getColor(color);

              const material = getBasicMaterial(
                THREE,
                `rgba(${c.red},${c.green},${c.blue},${op.itemStyle.opacity})`
              );
              //...

              //散点
              let geometry = new THREE.CircleGeometry(r, 32);

              let mesh = new THREE.Mesh(geometry, material);
              mesh.name = 'scatter-' + idx + '-' + index;

              mesh.rotateX(0.5 * Math.PI);
              mesh.position.set(pos[0], 0, pos[1]);
              this.scatterGroup.add(mesh);
              //波纹圈
              if (op.itemStyle.isCircle) {


                const {

    material: circleMaterial } = this.getCircleMaterial(
                 op.itemStyle.maxRadius * 20 * this.sizeScale,
                  color
                );

                let circle = new THREE.Mesh(new THREE.CircleGeometry(r * 2, 32), circleMaterial);
                circle.name = 'circle' + idx + '-' + index;
                circle.rotateX(0.5 * Math.PI);
                circle.position.set(pos[0], 0, pos[1]);

                this.circleGroup.add(circle);
              }
            }
          }
          //避免深度冲突,加个高度
          this.scatterGroup.position.y = 0.1 * this.sizeScale;
          if (op.itemStyle.isCircle) {


            this.circleGroup.position.y = 0.1 * this.sizeScale;
          }
        }
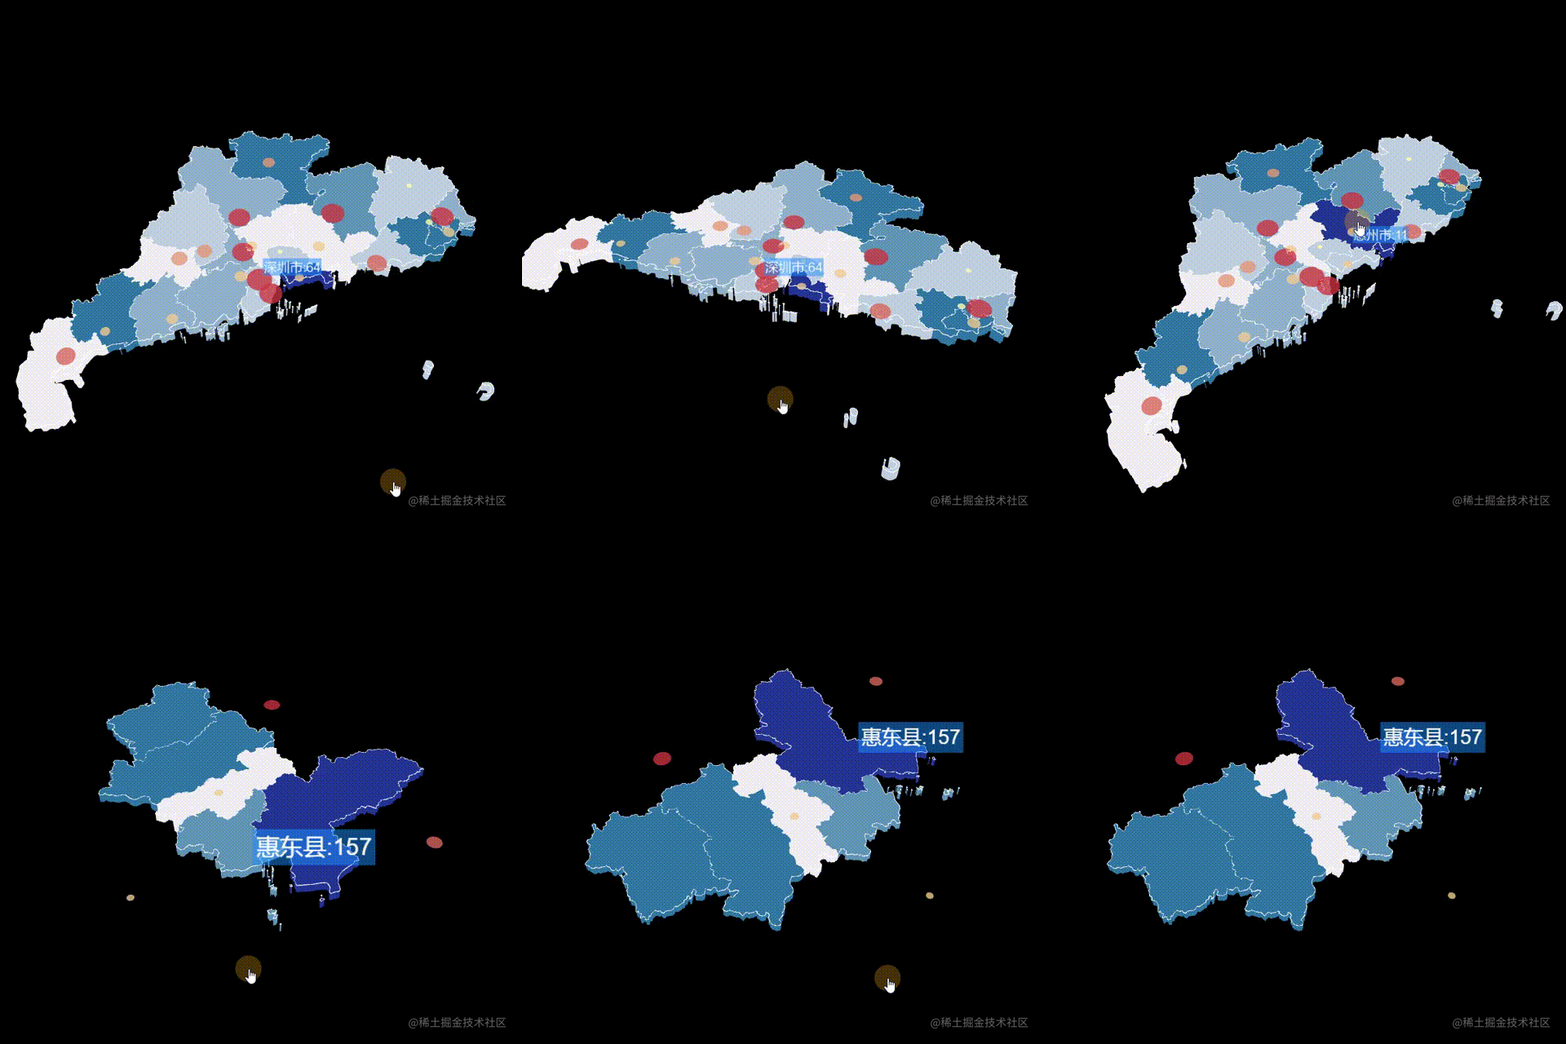
注意,这里做了范围过滤,超出区块范围的散点就不画了
checkBounding(pos) {


          if (
            pos[0] >= this.bounding.minlng &&
            pos[0] <= this.bounding.maxlng &&
            pos[1] >= this.bounding.minlat &&
            pos[1] <= this.bounding.maxlat
          ) {


            return true;
          }
          return false;
        }
(2) 波纹散点圈
getCircleMaterial(radius, color) {


          const canvas = document.createElement('canvas');
          canvas.height = radius * 3.1;
          canvas.width = radius * 3.1;
          const ctx = canvas.getContext('2d');
          ctx.clearRect(0, 0, canvas.width, canvas.height);
          ctx.strokeStyle = color;
          //画三个波纹圈
          //外圈
          ctx.lineWidth = radius * 0.2;
          ctx.beginPath();
          ctx.arc(canvas.width * 0.5, canvas.height * 0.5, radius, 0, 2 * Math.PI);
          ctx.closePath();
          ctx.stroke();
          //中圈
          ctx.lineWidth = radius * 0.1;
          ctx.beginPath();
          ctx.arc(canvas.width * 0.5, canvas.height * 0.5, radius * 1.3, 0, 2 * Math.PI);
          ctx.closePath();
          ctx.stroke();
          //内圈
          ctx.lineWidth = radius * 0.05;
          ctx.beginPath();
          ctx.arc(canvas.width * 0.5, canvas.height * 0.5, radius * 1.5, 0, 2 * Math.PI);
          ctx.closePath();
          ctx.stroke();

          const map = new THREE.CanvasTexture(canvas);
          map.wrapS = THREE.RepeatWrapping;
          map.wrapT = THREE.RepeatWrapping;
          let res = getColor(color);
          const material = new THREE.MeshBasicMaterial({


            map: map,
            transparent: true,
            color: new THREE.Color(`rgb(${res.red},${res.green},${

     res.blue})`),
            opacity: 1,
            // depthTest: false,
            side: THREE.DoubleSide
          });

          return {

    material, canvas };
        }
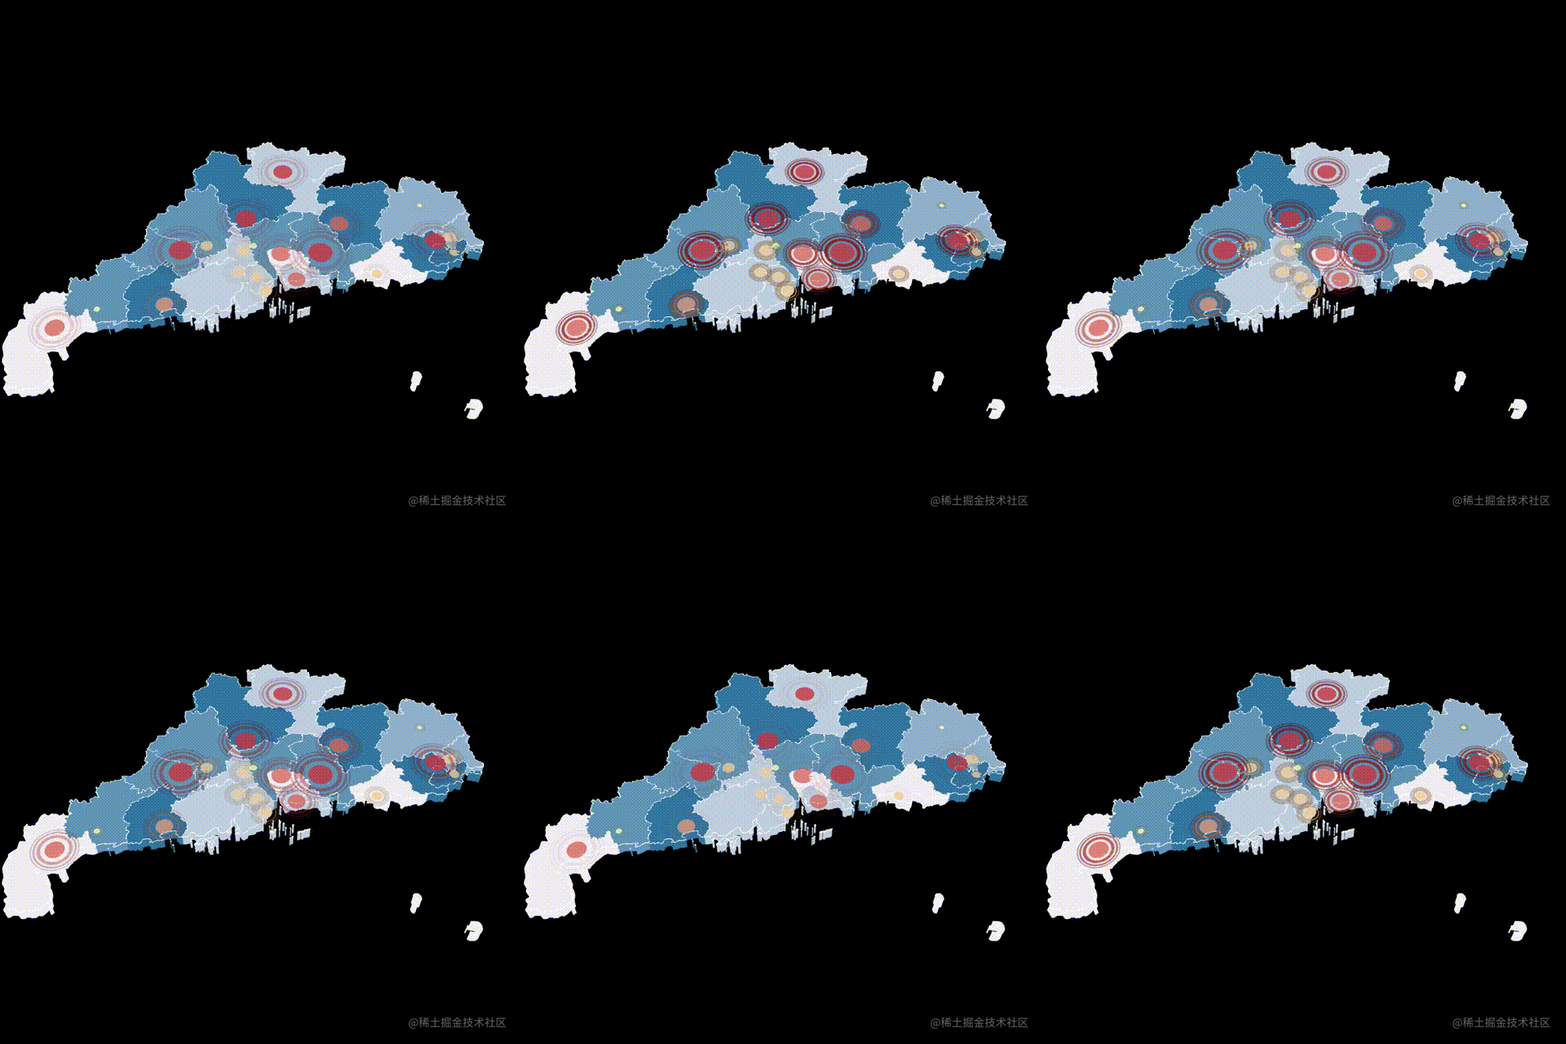
(3) 波纹圈动起来
 //散点波纹扩散
          if (this.circleGroup?.children?.length > 0) {


            this.circleGroup.children.forEach((elmt) => {


              if (elmt.material.opacity <= 0) {


                elmt.material.opacity = 1;
                this.circleScale = 1;
              } else {


                //大小变大,透明度减小
                elmt.material.opacity += -0.01;
                this.circleScale += 0.0002;
              }
              elmt.scale.x = this.circleScale;
              elmt.scale.y = this.circleScale;
            });
          }
(4)赋值,使用
{


      name: 'scatter3D',
      type: 'scatter3D',
      //数据
      data: mapJson.districts.map((item) => ({


        name: item.name,
        lat: item.center[1],
        lng: item.center[0],
        value: parseInt(Math.random() * 100)
      })),
      formatter: '{name}:{value}',
      itemStyle: {


        isCircle: true, //是否开启波纹圈
        opacity: 0.8,//透明度
        maxRadius: 5, //最大半径
        minRadius: 1, //最小半径
        //热力颜色
        colorList: ['rgb(255, 255, 178)', 'rgb(189, 0, 38)']
      }
    }
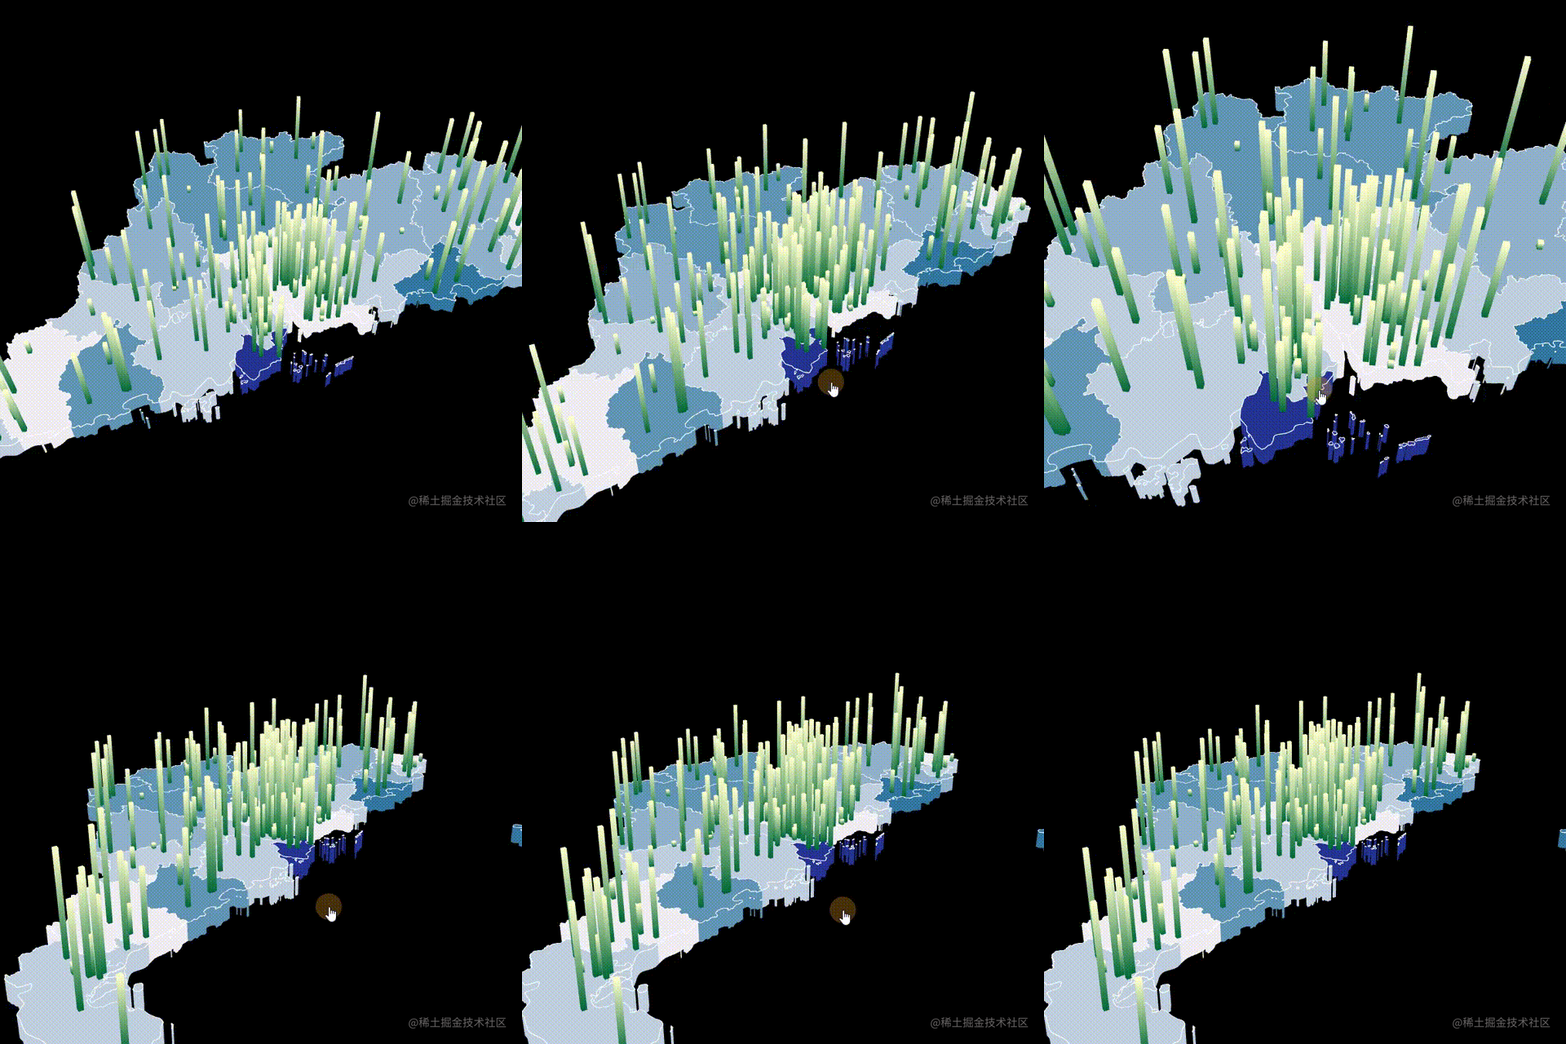
4.画柱体
(1)柱体顶点着色器
varying vec3 vNormal;
varying vec2 vUv;
void main()
{
  vNormal = normal;
  vUv=uv;
gl_Position = projectionMatrix * modelViewMatrix * vec4(position, 1.0);
}
(2)柱体片元着色器
  uniform vec3 topColor;
  uniform vec3 bottomColor;
      varying vec2 vUv;
      varying vec3 vNormal;
         void main() {
                 //顶面
        if(vNormal.y==1.0){
          gl_FragColor = vec4(topColor, 1.0 );
        }else if(vNormal.y==-1.0){//底面
          gl_FragColor = vec4(bottomColor, 1.0 );
        }else{//颜色混合形成渐变
          gl_FragColor = vec4(mix(bottomColor,topColor,vUv.y), 1.0 );
        }
    }
(3)创建渐变材质
export function getGradientShaderMaterial(THREE, topColor, bottomColor) {


  const uniforms = {


    topColor: {

    value: new THREE.Color(getRgbColor(topColor)) },
    bottomColor: {

    value: new THREE.Color(getRgbColor(bottomColor)) }
  };

  return new THREE.ShaderMaterial({


    uniforms: uniforms,
    vertexShader: vertexShader,
    fragmentShader: barShader,
    side: THREE.DoubleSide
  });
}
(4) 创建柱体
这里需要计算柱体高度,过滤区块范围外的柱体
 createBar(op, idx) {


 //渐变材质
          const material = getGradientShaderMaterial(
            THREE,
            op.itemStyle.topColor,
            op.itemStyle.bottomColor
          );
//数据整体情况

          let min = op.data[0].value,
            max = op.data[0].value;
          op.data.forEach((item) => {


            if (item.value < min) {


              min = item.value;
            }
            if (item.value > max) {


              max = item.value;
            }
          });

          let len = max - min;

          for (let index = 0; index < op.data.length; index++) {


            let item = op.data[index];

            let pos = latlng2px([item.lng, item.lat]);
        //柱体范围过滤
            if (this.checkBounding(pos)) {


            //计算柱体高度
             let h = (((item.value - min) / len) * op.itemStyle.maxHeight + op.itemStyle.minHeight) *
                this.sizeScale;

              let bar = new THREE.BoxGeometry(
                op.itemStyle.barWidth * this.sizeScale,
                h,
                op.itemStyle.barWidth * this.sizeScale
              );

              let barMesh = new THREE.Mesh(bar, material);
              barMesh.name = 'bar-' + idx + '-' + index;

              barMesh.position.set(pos[0], 0.5 * h, pos[1]);
              this.barGroup.add(barMesh);
            }
          }
        }
(5)赋值使用
 {


      name: 'bar3D',
      type: 'bar3D',
      formatter: '{name}:{value}',
      data: data.map((item) => ({


        name: item.name,
        code: item.code,
        lat: item.center[1],
        lng: item.center[0],
        value: parseInt(Math.random() * 180)
      })),
      itemStyle: {

       //
        maxHeight: 30,//柱体最大高度
        minHeight: 1,//柱体最小高度
        barWidth: 1,//柱体宽度
        topColor: 'rgb(255, 255, 204)',//上方颜色
        bottomColor: 'rgb(0, 104, 55)'//下方颜色
      }
    }
5.画飞线
(1)飞线着色器
            uniform float time;
            uniform vec3 colorA;
            uniform vec3 colorB;
            varying vec2 vUv;
                  void main() {
                  //根据时间和uv值控制颜色变化
                    vec3 color =vUv.x<time?colorB:colorA;
                    gl_FragColor = vec4(color,1.0);
                  }
(2)创建飞线的材质
export function getLineShaderMaterial(THREE, color, color1) {


  const uniforms = {


    time: {

    value: 0.0 },
    colorA: {

    value: new THREE.Color(getRgbColor(color)) },
    colorB: {

    value: new THREE.Color(getRgbColor(color1)) }
  };

  return new THREE.ShaderMaterial({


    uniforms: uniforms,
    vertexShader: vertexShader,
    fragmentShader: lineFShader,
    side: THREE.DoubleSide,
    transparent: true
  });
}
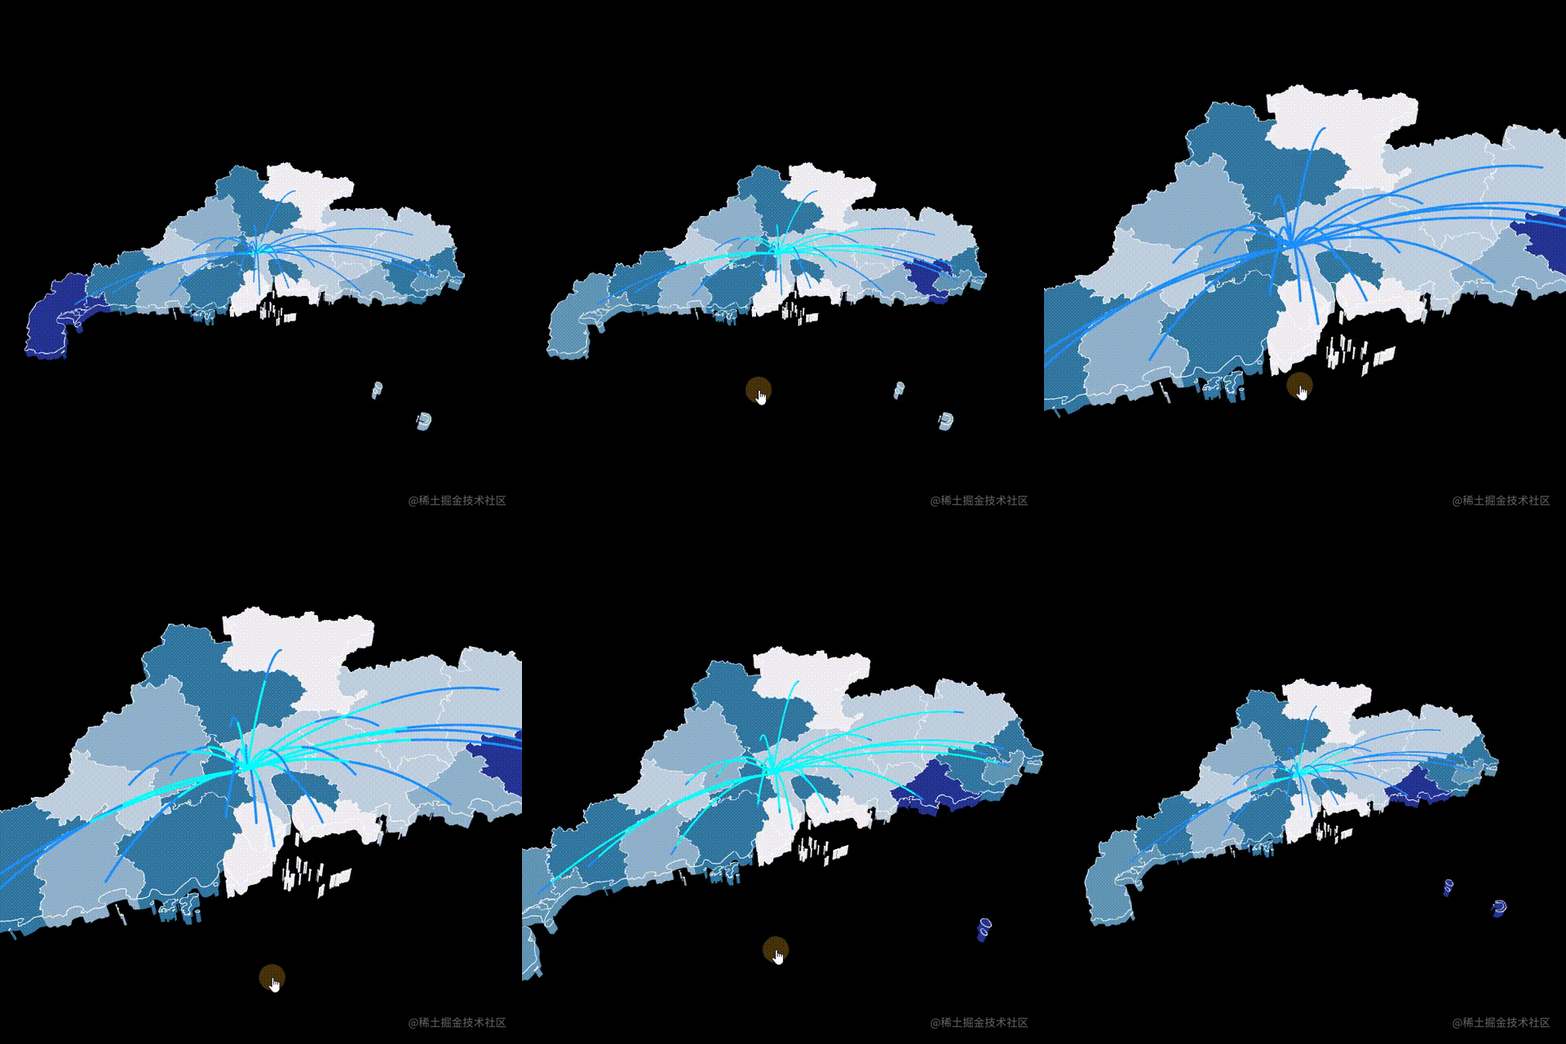
(3)创建飞线
这里的飞线管道用的是QuadraticBezierCurve3贝塞尔曲线算出来的
createLines(op, idx) {


          const material = getLineShaderMaterial(THREE, op.itemStyle.color, op.itemStyle.runColor);
          this.linesMaterial.push(material);
          for (let index = 0; index < op.data.length; index++) {


            let item = op.data[index];

            let pos = latlng2px([item.fromlng, item.fromlat]);
            let pos2 = latlng2px([item.tolng, item.tolat]);
            //过滤飞线范围
            if (this.checkBounding(pos) && this.checkBounding(pos2)) {


            //中间点
              let pos1 = latlng2px([
                (item.fromlng + item.tolng) / 2,
                (item.fromlat + item.tolat) / 2
              ]);
            //贝塞尔曲线
              const curve = new THREE.QuadraticBezierCurve3(
                new THREE.Vector3(pos[0], 0, pos[1]),
                new THREE.Vector3(pos1[0], op.itemStyle.lineHeight * this.sizeScale, pos1[1]),
                new THREE.Vector3(pos2[0], 0, pos2[1])
              );
              const geometry = new THREE.TubeGeometry(
                curve,
                32,
                op.itemStyle.lineWidth * this.sizeScale,
                8,
                false
              );

              const line = new THREE.Mesh(geometry, material);
              line.name = 'lines-' + idx + '-' + index;
              this.linesGroup.add(line);
            }
          }
        }
(4)让飞线动起来
给shader赋值,让飞线颜色动起来
//飞线颜色变化
          if (this.linesGroup?.children?.length > 0) {


            if (this.lineTime >= 1.0) {


              this.lineTime = 0.0;
            } else {


              this.lineTime += 0.005;
            }
            this.linesMaterial.forEach((m) => {


              m.uniforms.time.value = this.lineTime;
            });
          }
(5)赋值使用
  {


      name: 'lines3D',
      type: 'lines3D',
      formatter: '{name}:{value}',
      data: mapJson.districts.map((item) => ({


        fromlat: item.center[1],
        fromlng: item.center[0],
        tolat: mapJson.center[1],
        tolng: mapJson.center[0]
      })),
      itemStyle: {


        lineHeight: 20, //飞线中间点高度
        color: '#00FFFF', //原始颜色
        runColor: '#1E90FF', //变化颜色
        lineWidth: 0.3 //线宽
      }
    }
6.Github
我这里的格式是模仿echarts配置项的,所以柱体,飞线,散点可以存在多个不同系列。
https://github.com/xiaolidan00/my-three
