
说明
【跟月影学可视化】学习笔记。
什么是SVG
SVG 的全称是 Scalable Vector Graphics,可缩放矢量图,它是浏览器支持的一种基于 XML 语法的图像格式。
SVG 可以作为 HTML 内嵌元素使用,也可以作为图像通过 img 元素加载,或者绘制到 Canvas 内。
利用 SVG 绘制几何图形
svg 元素是 SVG 的根元素,属性 xmlns 是 xml 的名字空间。
<!DOCTYPE html>
<html lang="en">
    <head>
        <meta charset="UTF-8" />
        <meta http-equiv="X-UA-Compatible" content="IE=edge" />
        <meta name="viewport" content="width=device-width, initial-scale=1.0" />
        <title>如何用SVG图形元素绘制可视化图表</title>
    </head>
    <body>
        <svg xmlns="http://www.w3.org/2000/svg" version="1.1">
            <circle
                cx="100"
                cy="50"
                r="40"
                stroke="black"
                stroke-width="2"
                fill="orange"
            />
        </svg>
    </body>
</html>
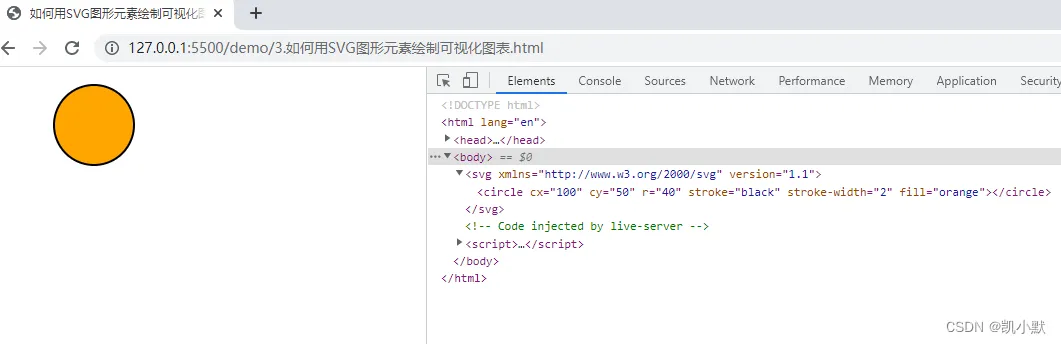
SVG 坐标系和 Canvas 坐标系完全一样,都是以图像左上角为原点,x 轴向右,y 轴向下的左手坐标系。可以通过给 svg 元素设置 viewBox 属性,来改变 SVG 的坐标系。
利用 SVG 绘制层次关系图
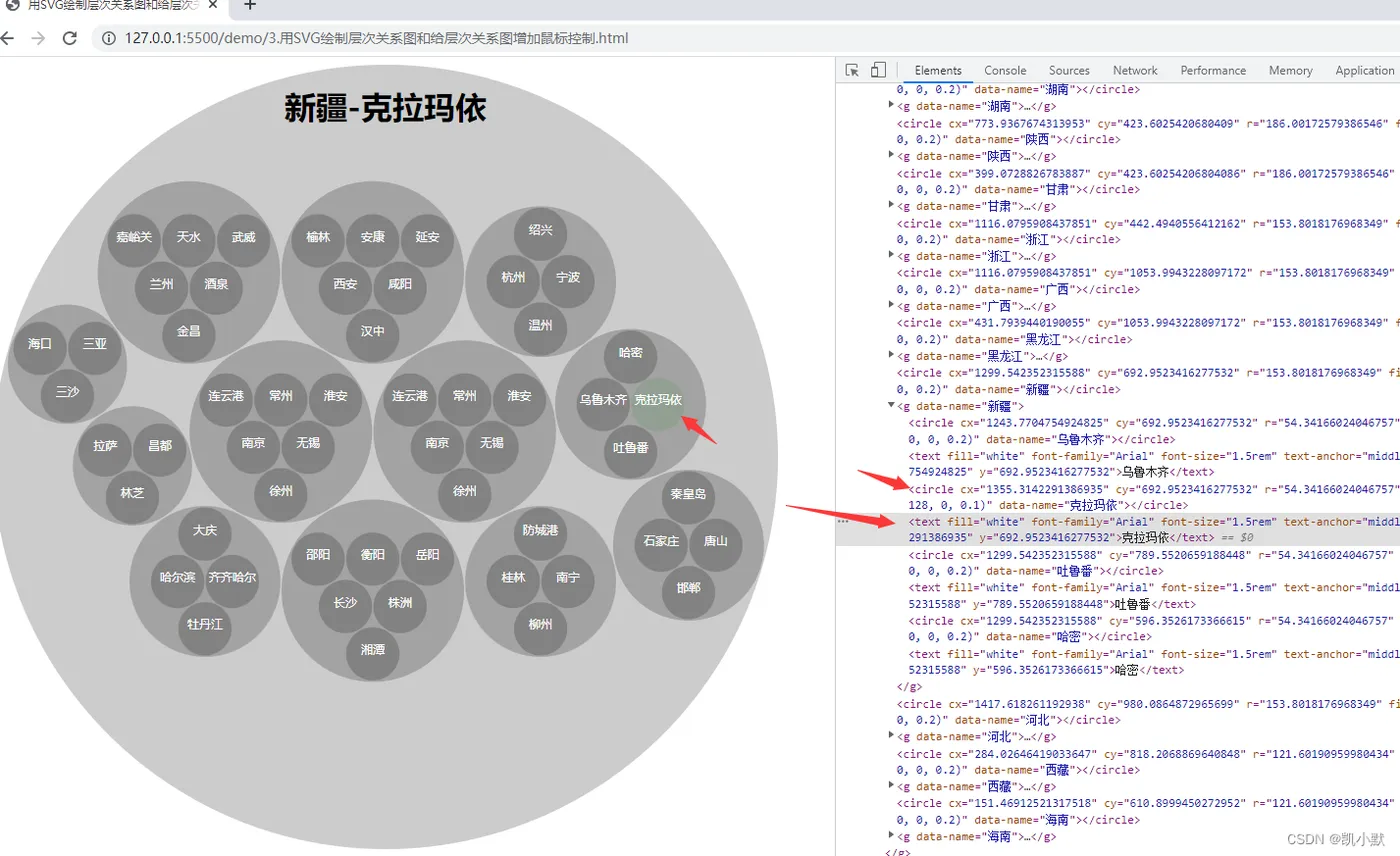
SVG 元素要使用 document.createElementNS 方法来创建。该方法用于创建一个具有指定的命名空间 URI 和限定名称的元素。
有效的命名空间 URI:
HTML - 参阅 http://www.w3.org/1999/xhtml
SVG - 参阅 http://www.w3.org/2000/svg
XBL - 参阅 http://www.mozilla.org/xbl
XUL - 参阅 http://www.mozilla.org/keymaster/gatekeeper/there.is.only.xul
<!DOCTYPE html>
<html lang="en">
<head>
    <meta charset="UTF-8">
    <meta http-equiv="X-UA-Compatible" content="IE=edge">
    <meta name="viewport" content="width=device-width, initial-scale=1.0">
    <title>用SVG绘制层次关系图和给层次关系图增加鼠标控制</title>
    <style>
        h1#title {
            position: absolute;
            width: 800px;
            text-align: center;
        }
    </style>
</head>
<body>
    <h1 id="title"></h1>
    <svg xmlns="http://www.w3.org/2000/svg" version="1.1" width="800" height="800" viewBox="0 0 1600 1600"></svg>
    <script src="https://d3js.org/d3-hierarchy.v1.min.js"></script>
    <script type="module">
        import dataSource from './data/map.js';
        // 用 d3.hierarchy(data).sum(…).sort(…) 将省份数据按照包含城市的数量,从多到少排序
        const regions = d3.hierarchy(dataSource)
            .sum(d => 1)
            .sort((a, b) => b.value - a.value);
        // 通过 d3.pack() 将数据映射为一组 1600 宽高范围内的圆形,留3px的padding
        const pack = d3.pack()
            .size([1600, 1600])
            .padding(3);
        const root = pack(regions);
        console.log(root)
        const svgroot = document.querySelector('svg');
        function draw(parent, node, { fillStyle = 'rgba(0, 0, 0, 0.2)', textColor = 'white' } = {}) {
            const children = node.children;
            const { x, y, r } = node;
            // 创建 circle 元素绘制圆型
            const circle = document.createElementNS('http://www.w3.org/2000/svg', 'circle');
            circle.setAttribute('cx', x);
            circle.setAttribute('cy', y);
            circle.setAttribute('r', r);
            circle.setAttribute('fill', fillStyle);
            circle.setAttribute('data-name', node.data.name);
            parent.appendChild(circle);
            if (children) {
                // SVG 的 g 元素表示一个分组,给 g 元素设置属性,那么它的子元素会继承这些属性。
                const group = document.createElementNS('http://www.w3.org/2000/svg', 'g');
                group.setAttribute('data-name', node.data.name);
                // 遍历子节点绘制
                for (let i = 0; i < children.length; i++) {
                    draw(group, children[i], {fillStyle, textColor});
                }
                parent.appendChild(group);
            } else {
                // 绘制文本
                const text = document.createElementNS('http://www.w3.org/2000/svg', 'text');
                text.setAttribute('fill', textColor);
                text.setAttribute('font-family', 'Arial');
                text.setAttribute('font-size', '1.5rem');
                text.setAttribute('text-anchor', 'middle');
                text.setAttribute('x', x);
                text.setAttribute('y', y);
                text.textContent = node.data.name;
                parent.appendChild(text);
            }
        }
        draw(svgroot, root);
        const titleEl = document.getElementById('title');
        // 获取文本
        function getTitle(target) {
            const name = target.getAttribute('data-name');
            if(target.parentNode && target.parentNode.nodeName === 'g') {
                const parentName = target.parentNode.getAttribute('data-name');
                return `${parentName}-${name}`;
            }
            return name;
        }
        // 给svg添加mousemove事件
        let activeTarget = null;
        svgroot.addEventListener('mousemove', (evt) => {
            let target = evt.target;
            // 如果是文本节点
            if(target.nodeName === 'text') {
                // previousSibling 返回当前节点的前一个兄弟节点,没有则返回null.
                // 因为这里的text前一个节点就是circle
                target = target.previousSibling;
            };
            // 判断是否是已经激活的
            if(activeTarget !== target) {
                if(activeTarget) {
                    activeTarget.setAttribute('fill', 'rgba(0, 0, 0, 0.2)')
                };
            }
            target.setAttribute('fill', 'rgba(0, 128, 0, 0.1)');
            activeTarget = target;
            titleEl.textContent = getTitle(target);
        });
    </script>
</body>
</html>
SVG 和 Canvas 的不同点
- 写法上的不同
- 用户交互实现上的不同
绘制大量几何图形时 SVG 的性能问题
可以使用虚拟 DOM 方案来尽可能地减少重绘,这样就可以优化 SVG 的渲染。但是这些方案只能解决一部分问题,当节点数太多时,这些方案也无能为力。这个时候,我们还是得依靠 Canvas 和 WebGL 来绘图,才能彻底解决问题。

![基于YOLOv8的无人机道路损伤检测[四类核心裂缝/坑洼识别]的识别项目|完整源码数据集+PyQt5界面+完整训练流程+开箱即用!](https://ucc.alicdn.com/6x3ykqt6vixgc/developer-article1706376/20260115/954e69a4aa204a2091758160713e38ec.png?x-oss-process=image/format,webp/resize,h_160,m_lfit)
