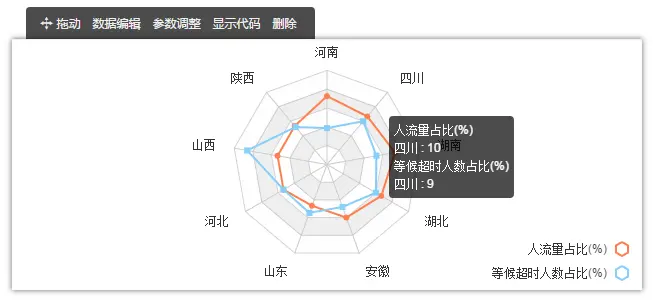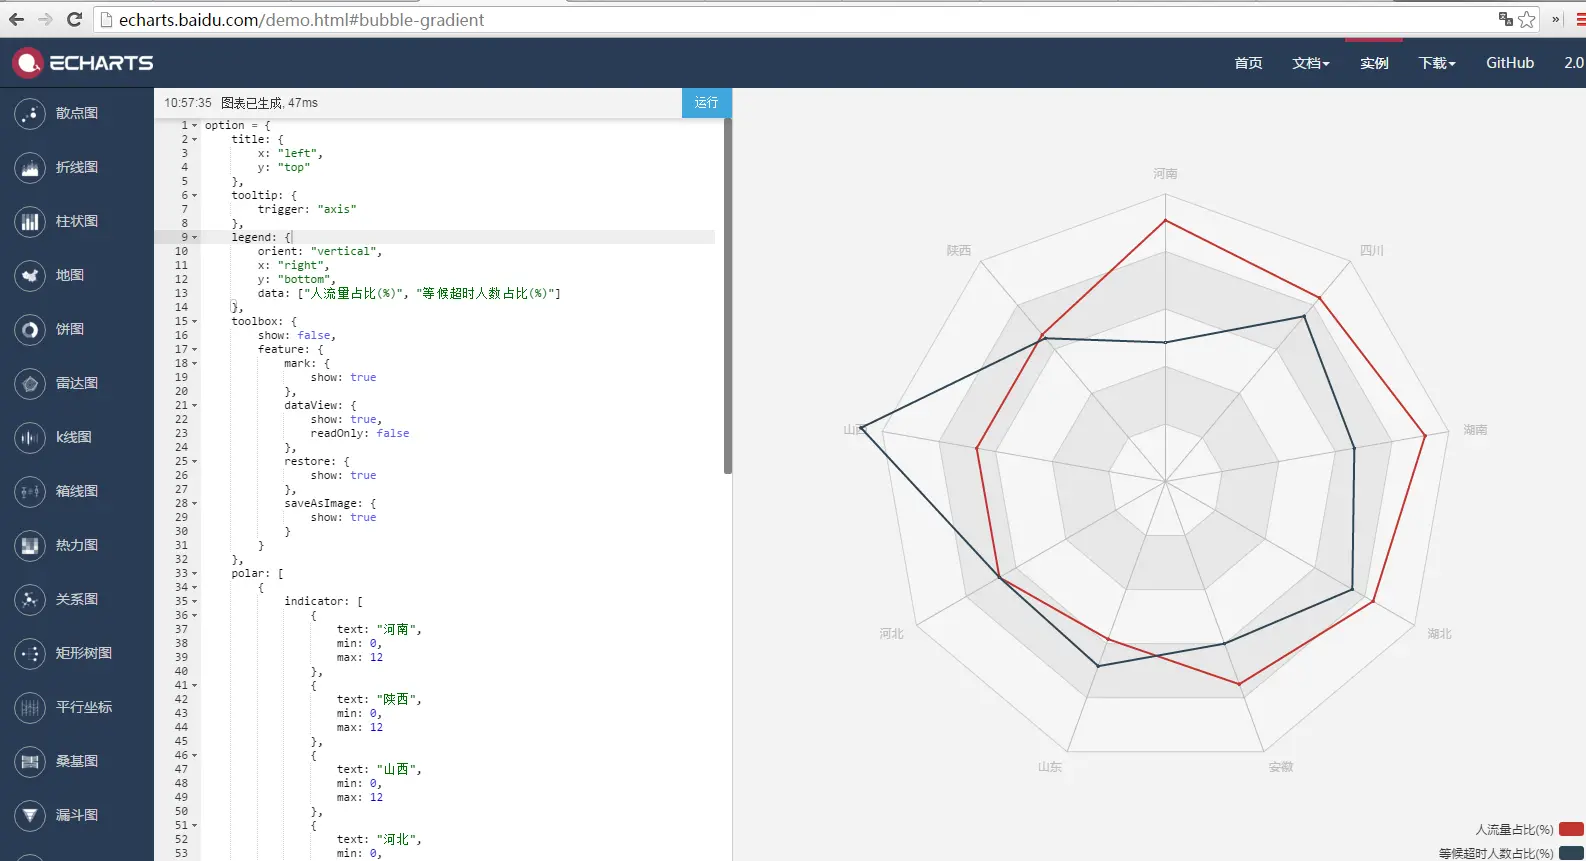
echarts3的雷达图,tooltip的触发方式设定为axis时无效:报错
我在图说中做了一个雷达图,在轴线上提示效果不错,可是同样的代码拿到echarts3官网的demo页面,却出不来提示。请问@Kener-林峰 ,想在雷达图的轴线上触发提示,仅在tooltip中写trigger:'axis'不行吗?
图说中的代码:
{
    title: {
        x: "left",
        y: "top"
    },
    tooltip: {
        trigger: "axis"
    },
    legend: {
        orient: "vertical",
        x: "right",
        y: "bottom",
        data: ["人流量占比(%)", "等候超时人数占比(%)"]
    },
    toolbox: {
        show: false,
        feature: {
            mark: {
                show: true
            },
            dataView: {
                show: true,
                readOnly: false
            },
            restore: {
                show: true
            },
            saveAsImage: {
                show: true
            }
        }
    },
    polar: [
        {
            indicator: [
                {
                    text: "河南",
                    min: 0,
                    max: 12
                },
                {
                    text: "陕西",
                    min: 0,
                    max: 12
                },
                {
                    text: "山西",
                    min: 0,
                    max: 12
                },
                {
                    text: "河北",
                    min: 0,
                    max: 12
                },
                {
                    text: "山东",
                    min: 0,
                    max: 12
                },
                {
                    text: "安徽",
                    min: 0,
                    max: 12
                },
                {
                    text: "湖北",
                    min: 0,
                    max: 12
                },
                {
                    text: "湖南",
                    min: 0,
                    max: 12
                },
                {
                    text: "四川",
                    min: 0,
                    max: 12
                }
            ],
            type: "polygon",
            axisLabel: {
                show: false
            }
        }
    ],
    calculable: true,
    series: [
        {
            name: "",
            type: "radar",
            data: [
                {
                    value: [10.9, 8, 8, 8, 7, 9, 10, 11, 10],
                    name: "人流量占比(%)"
                }
            ],
            symbolSize: 2
        },
        {
            name: "",
            type: "radar",
            data: [
                {
                    value: [5.8, 7.8, 12.9, 8, 8.2, 7.2, 9, 8, 9],
                    name: "等候超时人数占比(%)"
                }
            ],
            symbolSize: 2
        }
    ],
    animation: true,
    animationEasing: "ExponentialOut"
}


展开
收起
版权声明:本文内容由阿里云实名注册用户自发贡献,版权归原作者所有,阿里云开发者社区不拥有其著作权,亦不承担相应法律责任。具体规则请查看《阿里云开发者社区用户服务协议》和《阿里云开发者社区知识产权保护指引》。如果您发现本社区中有涉嫌抄袭的内容,填写侵权投诉表单进行举报,一经查实,本社区将立刻删除涉嫌侵权内容。
1
条回答
写回答
-
请问解决了吗,也正有这个问题,请教
@lwei : 刚刚解决,将<body>里边的<canvas>用<div>代替,可以出现提示了,例如 <div id="myCharts" style="height:500px;width:100px;"></div>######未解决,官网的issue里有这个问题,你可以去看看,我是直接重新设计图形了######
######回复 @迈着小碎步走向不归路 : http://blog.csdn.net/agax0312/article/details/54927263看看可以吗######http://blog.csdn.net/agax0312/article/details/54927263######回复2020-06-14 12:05:31赞同 展开评论
相关问答
