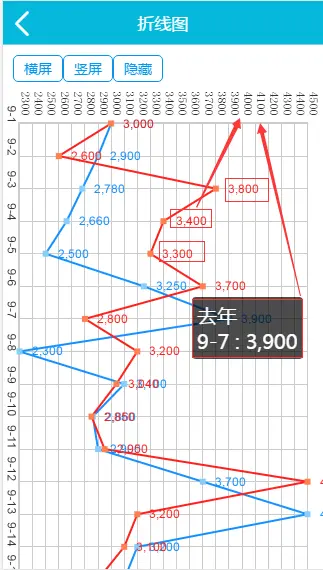
@Kener-林峰 echarts折线图/柱状图横屏显示时,红色框部分的label文字应该怎么旋转90度显示,就跟x轴上的数值一样,打横显示,跪求解决方案,api已经看过,针对柱状图/折线图给series里itemStyle中的label设置rotate:90无效。

//横向折线图
var optionX = {
	tooltip:{
	        show:true
	},
	grid: {
                x: '5%',
                x2: '5%',
                y: '8%',
                y2: '5%',
                containLabel: true
        },
	legend:{
		data:['今年','去年'],
		x: '30px',
		y: 'bottom'
	},
	xAxis:[{
		type:'value',
		show:true,
		position:'top',
		axisLabel:{
    		show: true,
    		rotate:-90,
    		formatter:'{value}',
		textStyle :{
                    fontSize : '22px',
                    fontFamily : '微软雅黑'
                }
    	},
	axisLine:{
                lineStyle:{
                    color:'#CDCDCD'
                }
    	},
    	min:2300,
	max:4500,
	splitNumber:22,
    	splitLine:{
             show:true
       }
	}],
	yAxis:[{
		type:'category',
		show:true,
		boundaryGap: false,
data:["9-1","9-2","9-3","9-4","9-5","9-6","9-7","9-8","9-9","9-10","9-11","9-12","9-13","9-14","9-15"].reverse(),
		axisLine:{
                      lineStyle:{
                      color:'#CDCDCD'
                }
    	},
    	axisLabel:{
		rotate:-90,
		show: true,
		interval:0
	},
	axisTick: {
    		show:false
    	},
	splitLine:{
             show:true
      }
	}],
	series:[
	{
		name:'今年',
		type:'line',
		symbol:'none',
		itemStyle:{
			normal:{
				label : {
                                   rotate:-90,
					show: true,
					textStyle:{
						color:'#FD211E'
					}
				},
				lineStyle:{
					color:'#FD211E'
				}
			}
		},
		data:[3000,2600,3800,3400,3300,3700,2800,3200,3040,2850,2950,4500,3200,3100,2900].reverse()
	},{
		name:'去年',
		type:'line',
		symbol:'none',
		itemStyle:{
			normal:{
				label : {
                                   rotate:-90,
					show: true,
					textStyle:{
						color:'#1790FE'
					}
				},
				lineStyle:{
					color:'#1790FE'
				}
			}
		},
		data:[3000,2900,2780,2660,2500,3250,3900,2300,3100,2860,2900,3700,4500,3200,3100].reverse()
	}]
};
版权声明:本文内容由阿里云实名注册用户自发贡献,版权归原作者所有,阿里云开发者社区不拥有其著作权,亦不承担相应法律责任。具体规则请查看《阿里云开发者社区用户服务协议》和《阿里云开发者社区知识产权保护指引》。如果您发现本社区中有涉嫌抄袭的内容,填写侵权投诉表单进行举报,一经查实,本社区将立刻删除涉嫌侵权内容。