在开始写代码之前,我们要讲一下几个基础的GEE中内置的一些用法:
ee.Date(date, tz)
Constructs a new Date object.构造一个新的时间对象
Arguments:
date (ComputedObject|Date|Number|String):计算的数据类型包括了哪些
The date to convert, one of: a number (number of milliseconds since the epoch), an ISO Date string, a JavaScript Date or a ComputedObject.
要转换的日期,分别可以是以下之一:数字(自纪元以来的毫秒数)、ISO 日期字符串、JavaScript 日期或 ComputedObject。
tz (String, optional):时区的选择,一般情况下可以忽略。
An optional timezone only to be used with a string date.
仅与字符串日期一起使用的可选时区
Returns: Date
difference(start, unit)
Returns the difference between two Dates in the specified units; the result is floating-point and based on the average length of the unit.
以指定单位返回两个日期之间的差值;结果是浮点数并基于单位的平均长度。一般情况下输入你的开始时间和你要精确到的单位。
Arguments:
this:date (Date)
start (Date)
unit (String):
One of 'year', 'month' 'week', 'day', 'hour', 'minute', or 'second'.
Returns: Float
ee.Reducer.linearFit()
Returns a Reducer that computes the slope and offset for a (weighted) linear regression of 2 inputs. The inputs are expected to be x data followed by y data..
这个就相当于计算斜率,根据你输入的x值来改变Y的变化,
No arguments.
Returns: Reducer
好了接下来进行代码分析:
//先进行时间函数的确立,并添加波段,方便一会进行map遍历分析
function createTimeBand(img) {
  var year = img.date().difference(ee.Date('1990-01-01'), 'year');
  return ee.Image(year).float().addBands(img);
}
// Fit a linear trend to the nighttime lights collection.
var collection = ee.ImageCollection('NOAA/DMSP-OLS/CALIBRATED_LIGHTS_V4')
    .select('avg_vis')
    .map(createTimeBand);
//通过ee.Reducer.linearFit()来计算其变化趋势
var fit = collection.reduce(ee.Reducer.linearFit());
//选择第一张影像进行分析和展示
// Display a single image
Map.addLayer(ee.Image(collection.select('avg_vis').first()),
         {min: 0, max: 63},
         'stable lights first asset');
// Display trend in red/blue, brightness in green.
//展示变化趋势,分别用'scale', 'offset', 'scale'三个波段来进行颜色区分
Map.setCenter(30, 45, 4);
Map.addLayer(fit,
         {min: 0, max: [0.18, 20, -0.18], bands: ['scale', 'offset', 'scale']},
         'stable lights trend');
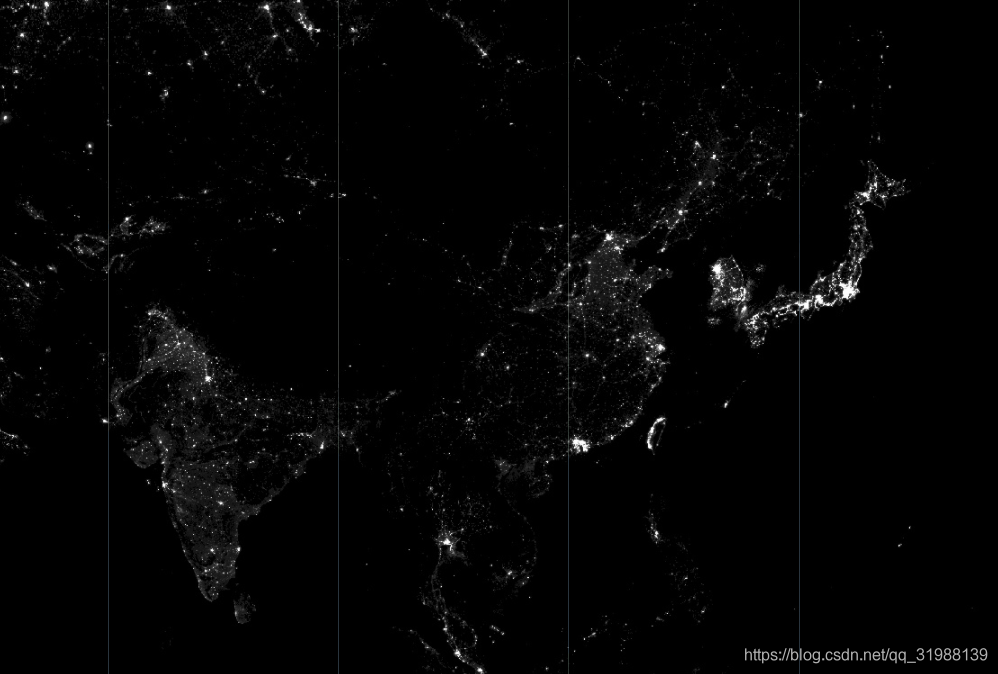
这是分析的第一张影像结果图
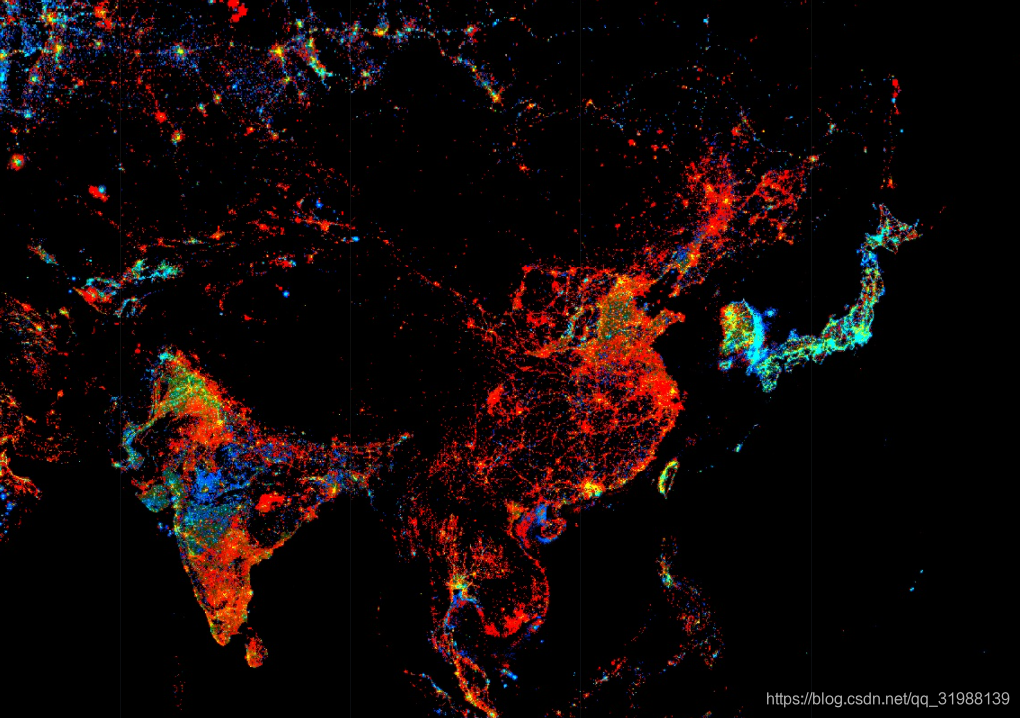
再来看看咱们大中国的变化: