
前言
在前端部署过程中,通常会使用nginx作为部署服务器,而对于默认的nginx服务来说,其提供了对应的日志记录,可以用于记录服务器访问的相关日志,对于系统稳定性及健壮性监控来说,日志采集、分析等能够提供更加量化的指标性建设,本文旨在简述前端应用及打点服务过程中所需要使用的nginx采集方案。
架构
打点日志采集

对于前端应用来说,通常需要埋点及处理对应的数据服务
应用日志采集
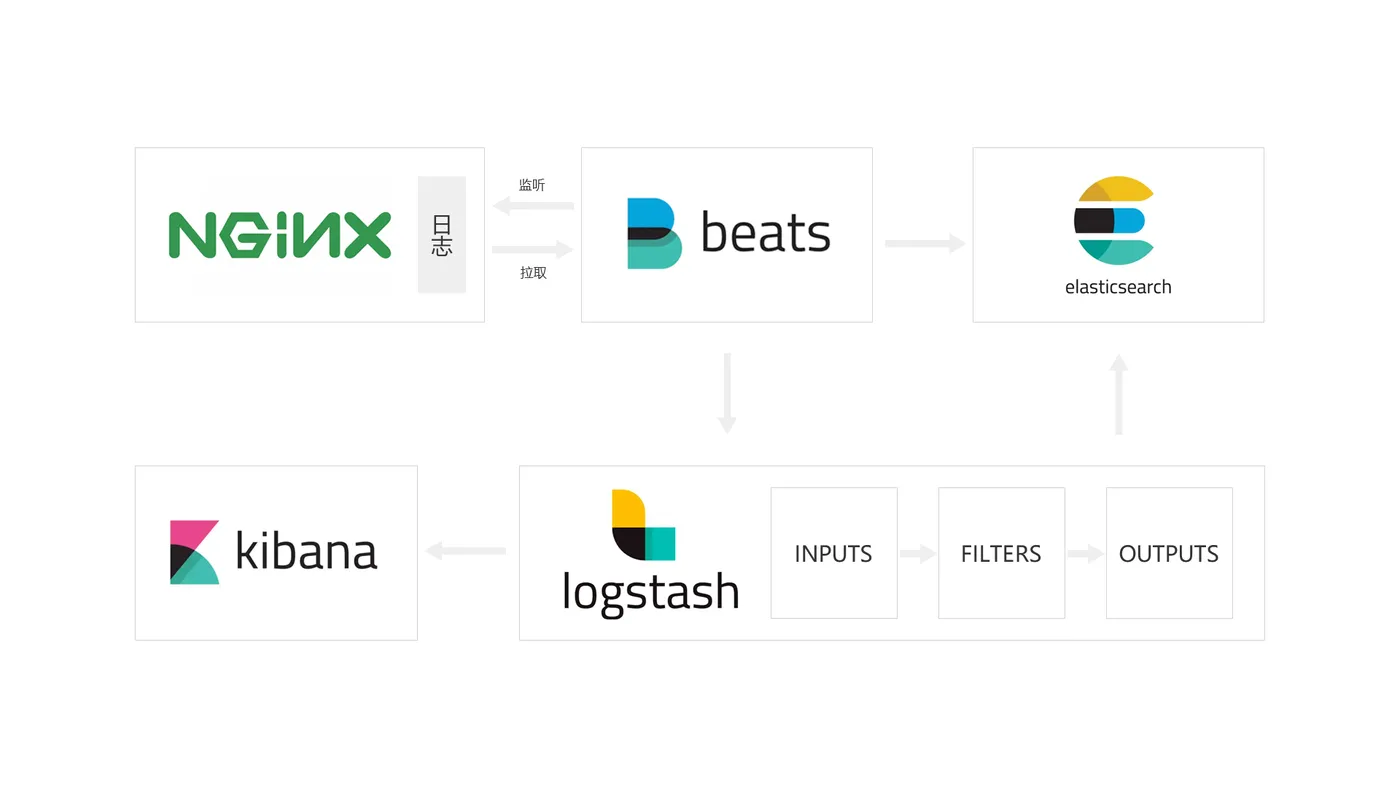
对于日常应用来说,通常需要对nginx服务器本身的稳定性进行收集处理
实践
Nginx
日志格式
设置日志格式 log_format 为约定的日志内容,可以用于日志清洗及过滤等,对于nginx的日志格式可以参看Nginx log_format官方文档
| 字段 | 含义 |
|---|---|
| $time_iso8601 | 服务器时间的ISO 8610格式 |
| $remote_addr | 客户端地址 |
| $http_host | 主机名 |
| $status | HTTP响应代码 |
| $request_time | 处理客户端请求使用的时间 |
| $request_length | 请求的长度 |
| $body_bytes_sent | 传输给客户端的字节数 |
| $request_uri | 包含一些客户端请求参数的原始URI |
| $http_user_agent | 客户端用户代理 |
日志路径
配置server的access_log,例如:
# /etc/nginx/nginx.conf
http {
    log_format aaa '$time_iso8601 $remote_addr $http_host $status $request_time $request_length $body_bytes_sent $request_uri $http_user_agent';

    access_log  /var/log/nginx/access.log  aaa;

    server {

        if ($time_iso8601 ~ "^(\d{4})-(\d{2})-(\d{2})T(\d{2}):(\d{2})") {
            set $year $1;
            set $month $2;
            set $day $3;
            set $hour $4;
            set $minute $5;
        }
        access_log /var/log/nginx/aaa/$year$month-$day-$hour-$minute.log aaa;

        location = /dig.gif {
            empty_gif;
        }
    }
}
日志清除
为防止nginx产生的日志占满磁盘,需要定期清除,可以设置清除的时间间隔为1天,例如:
#!/bin/bash
#Filename: delete_nginx_logs.sh
LOGS_PATH=/var/log/nginx
KEEP_DAYS=30
PID_FILE=/run/nginx.pid
YESTERDAY=$(date -d "yesterday" +%Y-%m-%d)
if [ -f $PID_FILE ];then
    echo `date "+%Y-%m-%d %H:%M:%S"` Deleting logs...
    mv ${LOGS_PATH}/access.log ${LOGS_PATH}/access.${YESTERDAY}.log >/dev/null 2>&1
    mv ${LOGS_PATH}/access.json ${LOGS_PATH}/access.${YESTERDAY}.json >/dev/null 2>&1
    mv ${LOGS_PATH}/error.log ${LOGS_PATH}/error.${YESTERDAY}.log >/dev/null 2>&1
    kill -USR1 `cat $PID_FILE`
    echo `date "+%Y-%m-%d %H:%M:%S"` Logs have deleted.
else
    echo `date "+%Y-%m-%d %H:%M:%S"` Please make sure that nginx is running...
fi
echo

find $LOGS_PATH -type f -mtime +$KEEP_DAYS -print0 |xargs -0 rm -f
也可以建立一个删除日志的脚本,用于记录删除脚本的日志
Filebeat
filebeat是一个日志文件托运工具,在你的服务器上安装客户端后,filebeat会监控日志目录或者指定的日志文件,追踪读取这些文件(追踪文件的变化,不停的读),并且转发这些信息到elasticsearch或者logstarsh或者kafka等。
通过 filebeat.yml 进行相关的配置,例如:
###################### Filebeat Configuration Example #########################

# This file is an example configuration file highlighting only the most common
# options. The filebeat.reference.yml file from the same directory contains all the
# supported options with more comments. You can use it as a reference.
#
# You can find the full configuration reference here:
# https://www.elastic.co/guide/en/beats/filebeat/index.html

# For more available modules and options, please see the filebeat.reference.yml sample
# configuration file.

# ============================== Filebeat inputs ===============================

filebeat.inputs:

# Each - is an input. Most options can be set at the input level, so
# you can use different inputs for various configurations.
# Below are the input specific configurations.

- type: log

# Change to true to enable this input configuration.
enabled: true

# Paths that should be crawled and fetched. Glob based paths.
paths:
    - /var/log/nginx/ferms/*.log
    #- c:\programdata\elasticsearch\logs\*

# Exclude lines. A list of regular expressions to match. It drops the lines that are
# matching any regular expression from the list.
#exclude_lines: ['^DBG']

# Include lines. A list of regular expressions to match. It exports the lines that are
# matching any regular expression from the list.
#include_lines: ['^ERR', '^WARN']

# Exclude files. A list of regular expressions to match. Filebeat drops the files that
# are matching any regular expression from the list. By default, no files are dropped.
#exclude_files: ['.gz$']

# Optional additional fields. These fields can be freely picked
# to add additional information to the crawled log files for filtering
#fields:
#  level: debug
#  review: 1

### Multiline options

# Multiline can be used for log messages spanning multiple lines. This is common
# for Java Stack Traces or C-Line Continuation

# The regexp Pattern that has to be matched. The example pattern matches all lines starting with [
#multiline.pattern: ^\[

# Defines if the pattern set under pattern should be negated or not. Default is false.
#multiline.negate: false

# Match can be set to "after" or "before". It is used to define if lines should be append to a pattern
# that was (not) matched before or after or as long as a pattern is not matched based on negate.
# Note: After is the equivalent to previous and before is the equivalent to to next in Logstash
#multiline.match: after

# ============================== Filebeat modules ==============================

filebeat.config.modules:
# Glob pattern for configuration loading
path: ${path.config}/modules.d/*.yml

# Set to true to enable config reloading
reload.enabled: false

# Period on which files under path should be checked for changes
#reload.period: 10s

# ======================= Elasticsearch template setting =======================

setup.template.settings:
index.number_of_shards: 3
#index.codec: best_compression
#_source.enabled: false


# ================================== General ===================================

# The name of the shipper that publishes the network data. It can be used to group
# all the transactions sent by a single shipper in the web interface.
#name:

# The tags of the shipper are included in their own field with each
# transaction published.
#tags: ["service-X", "web-tier"]

# Optional fields that you can specify to add additional information to the
# output.
#fields:
#  env: staging

# ================================= Dashboards =================================
# These settings control loading the sample dashboards to the Kibana index. Loading
# the dashboards is disabled by default and can be enabled either by setting the
# options here or by using the `setup` command.
#setup.dashboards.enabled: false

# The URL from where to download the dashboards archive. By default this URL
# has a value which is computed based on the Beat name and version. For released
# versions, this URL points to the dashboard archive on the artifacts.elastic.co
# website.
#setup.dashboards.url:

# =================================== Kibana ===================================

# Starting with Beats version 6.0.0, the dashboards are loaded via the Kibana API.
# This requires a Kibana endpoint configuration.
setup.kibana:

# Kibana Host
# Scheme and port can be left out and will be set to the default (http and 5601)
# In case you specify and additional path, the scheme is required: http://localhost:5601/path
# IPv6 addresses should always be defined as: https://[2001:db8::1]:5601
#host: "localhost:5601"

# Kibana Space ID
# ID of the Kibana Space into which the dashboards should be loaded. By default,
# the Default Space will be used.
#space.id:

# =============================== Elastic Cloud ================================

# These settings simplify using Filebeat with the Elastic Cloud (https://cloud.elastic.co/).

# The cloud.id setting overwrites the `output.elasticsearch.hosts` and
# `setup.kibana.host` options.
# You can find the `cloud.id` in the Elastic Cloud web UI.
#cloud.id:

# The cloud.auth setting overwrites the `output.elasticsearch.username` and
# `output.elasticsearch.password` settings. The format is `<user>:<pass>`.
#cloud.auth:

# ================================== Outputs ===================================

# Configure what output to use when sending the data collected by the beat.

output.kafka:
    hosts: ["xxx.xxx.xxx.xxx:9092","yyy.yyy.yyy.yyy:9092","zzz.zzz.zzz.zzz:9092"]
    topic: "fee"

# ---------------------------- Elasticsearch Output ----------------------------
#output.elasticsearch:
# Array of hosts to connect to.
#hosts: ["localhost:9200"]

# Protocol - either `http` (default) or `https`.
#protocol: "https"

# Authentication credentials - either API key or username/password.
#api_key: "id:api_key"
#username: "elastic"
#password: "changeme"

# ------------------------------ Logstash Output -------------------------------
#output.logstash:
# The Logstash hosts
#hosts: ["localhost:5044"]

# Optional SSL. By default is off.
# List of root certificates for HTTPS server verifications
#ssl.certificate_authorities: ["/etc/pki/root/ca.pem"]

# Certificate for SSL client authentication
#ssl.certificate: "/etc/pki/client/cert.pem"

# Client Certificate Key
#ssl.key: "/etc/pki/client/cert.key"

# ================================= Processors =================================
processors:
- drop_fields:
    fields: ["@timestamp", "@metadata", "log", "input", "ecs", "host", "agent"]

# ================================== Logging ===================================

# Sets log level. The default log level is info.
# Available log levels are: error, warning, info, debug
# logging.level: debug

# At debug level, you can selectively enable logging only for some components.
# To enable all selectors use ["*"]. Examples of other selectors are "beat",
# "publish", "service".
#logging.selectors: ["*"]

# ============================= X-Pack Monitoring ==============================
# Filebeat can export internal metrics to a central Elasticsearch monitoring
# cluster.  This requires xpack monitoring to be enabled in Elasticsearch.  The
# reporting is disabled by default.

# Set to true to enable the monitoring reporter.
#monitoring.enabled: false

# Sets the UUID of the Elasticsearch cluster under which monitoring data for this
# Filebeat instance will appear in the Stack Monitoring UI. If output.elasticsearch
# is enabled, the UUID is derived from the Elasticsearch cluster referenced by output.elasticsearch.
#monitoring.cluster_uuid:

# Uncomment to send the metrics to Elasticsearch. Most settings from the
# Elasticsearch output are accepted here as well.
# Note that the settings should point to your Elasticsearch *monitoring* cluster.
# Any setting that is not set is automatically inherited from the Elasticsearch
# output configuration, so if you have the Elasticsearch output configured such
# that it is pointing to your Elasticsearch monitoring cluster, you can simply
# uncomment the following line.
#monitoring.elasticsearch:

# ============================== Instrumentation ===============================

# Instrumentation support for the filebeat.
#instrumentation:
    # Set to true to enable instrumentation of filebeat.
    #enabled: false

    # Environment in which filebeat is running on (eg: staging, production, etc.)
    #environment: ""

    # APM Server hosts to report instrumentation results to.
    #hosts:
    #  - http://localhost:8200

    # API Key for the APM Server(s).
    # If api_key is set then secret_token will be ignored.
    #api_key:

    # Secret token for the APM Server(s).
    #secret_token:


# ================================= Migration ==================================

# This allows to enable 6.7 migration aliases
#migration.6_to_7.enabled: true
总结
日志系统作为大型系统的重要组成部分,在前端侧的应用过程中通常不如后端体系那么庞大和重视,但其重要的数据支撑作用在前端系统中也是不可或缺的,对于日志的过滤清洗及分析也可以在前端体系中做一些对应生态建设。